
Page Contents
Introduction:
The Department of Health and Social Care’s (DHSC) priority to “protect and level up the nation’s health through reducing health disparities” has identified Healthy life expectancy (HLE) as a key outcome measure nationally in assessing the extent to which health is improving and disparities are narrowing.
This briefing outlines what we mean by healthy life expectancy and why it is important; what HLE looks like and what drives HLE nationally and locally; self-reported health status in East Sussex and what impacts on our self-reporting of our general health; best practice to address the HLE gap, and what we are doing about it in East Sussex.
- Life expectancy is the average number of years from birth someone would be expected to live
- Healthy life expectancy is the average number of years from birth someone would be expected to live in a state of good general health.
This report focuses specifically on healthy life expectancy: how long someone is expected to life in good health.
Why is Healthy Life Expectancy (HLE) important?
HLE has been identified as a key outcome measure in assessing the extent to which health is improving and disparities are narrowing across our population.[Endnote 1] HLE divides our expected lifespan into time spent in different states of health or disability.[Endnote 2] This is important because the duration of the period of ill health near the end of life has significant personal and societal implications, including poorer quality of life, poorer health outcomes, more frequent hospital admissions and higher risk for premature mortality.[Endnote 3],[Endnote 4],[Endnote 5]
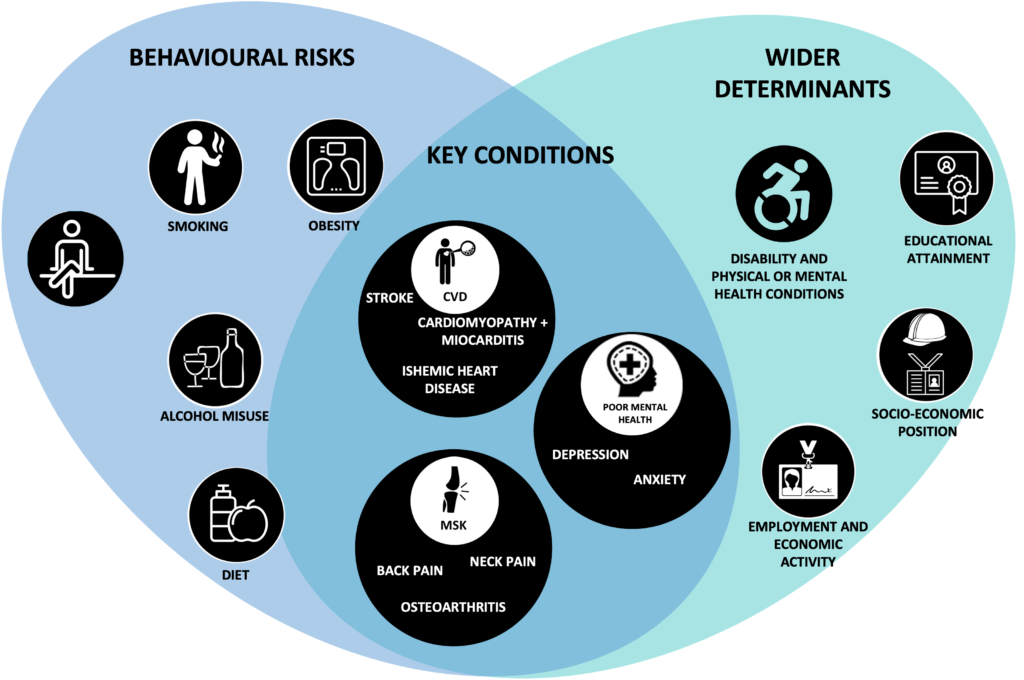
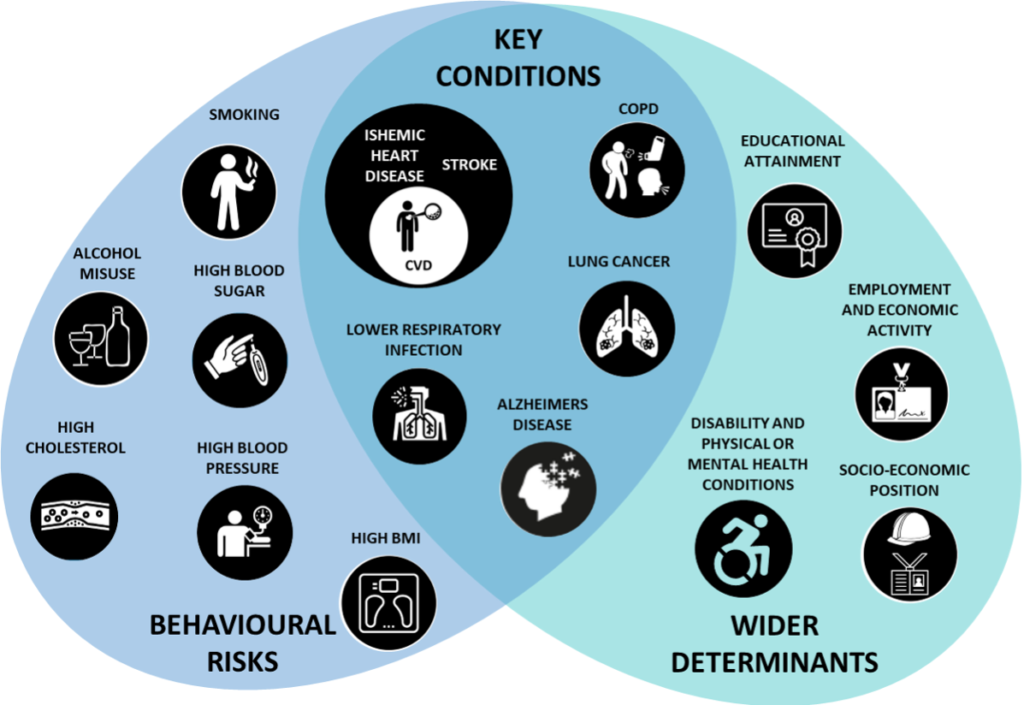
Across our lives there is systematic variation in both protective and risk factors of health which lead to differing trajectories and outcomes over the course of a person’s life. This in turn impacts on our life expectancy and healthy life expectancy. [Endnote 6] A person’s physical and mental health and wellbeing are influenced throughout life by social, economic, environmental and behavioural risk factors (wider determinants of health) which often cluster in the population.[Endnote 6] Those more impacted by the negative influences of health, are more likely to have shorter life expectancy and more years living with disability.[Endnote 6]
These health inequalities are driven by a variety of risk factors such as smoking rates, access to and quality of health and care, housing quality and living environment.[Endnote 7]
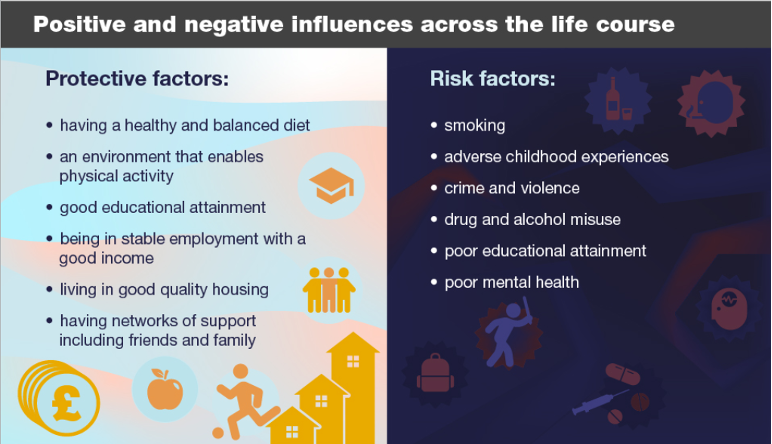
Source: UKHSA (UK Health Security Agency), 2019
Inequalities affecting the life course trajectory can be reduced for the whole population and future generations by altering policies, environments, and societal norms. To extend healthy life expectancy and reduce the gap between those with the longest and shortest estimated healthy life span, key opportunities need to be identified to minimise risk factors and enhance protective factors through evidence-based interventions at key life stages.[Endnote 6]
Summary:
- Improvements in healthy life expectancy in East Sussex are stalling
- Female healthy life expectancy in East Sussex is 63.3 years
- Male healthy life expectancy in East Sussex is 63.1 years
- The gap between areas with the highest and lowest healthy life expectancy in East Sussex is nearly 20 years.
- Those in more deprived areas report poorer health
Key Findings:
- HLE is flat lining: Improvements in health life expectancy are stalling
- Circa 20 year HLE gap: There is a gap of nearly 20 years in healthy life expectancy for both men and women between the most and least deprived areas
- County variation in HLE: Healthy life expectancy is highest in Frant and Groombridge and lowest in Central St Leonards and Hollington
- Health-deprivation link: Those in more deprived areas live more of their lives in poorer health
- Self-reported health varies by ward:Twice as many people report they are in poor health In Hastings compared to Wealden
- Improve self-reported health to improve HLE: changes in self-reported good health prevalence have a larger impact on HLE than changes in mortality rates
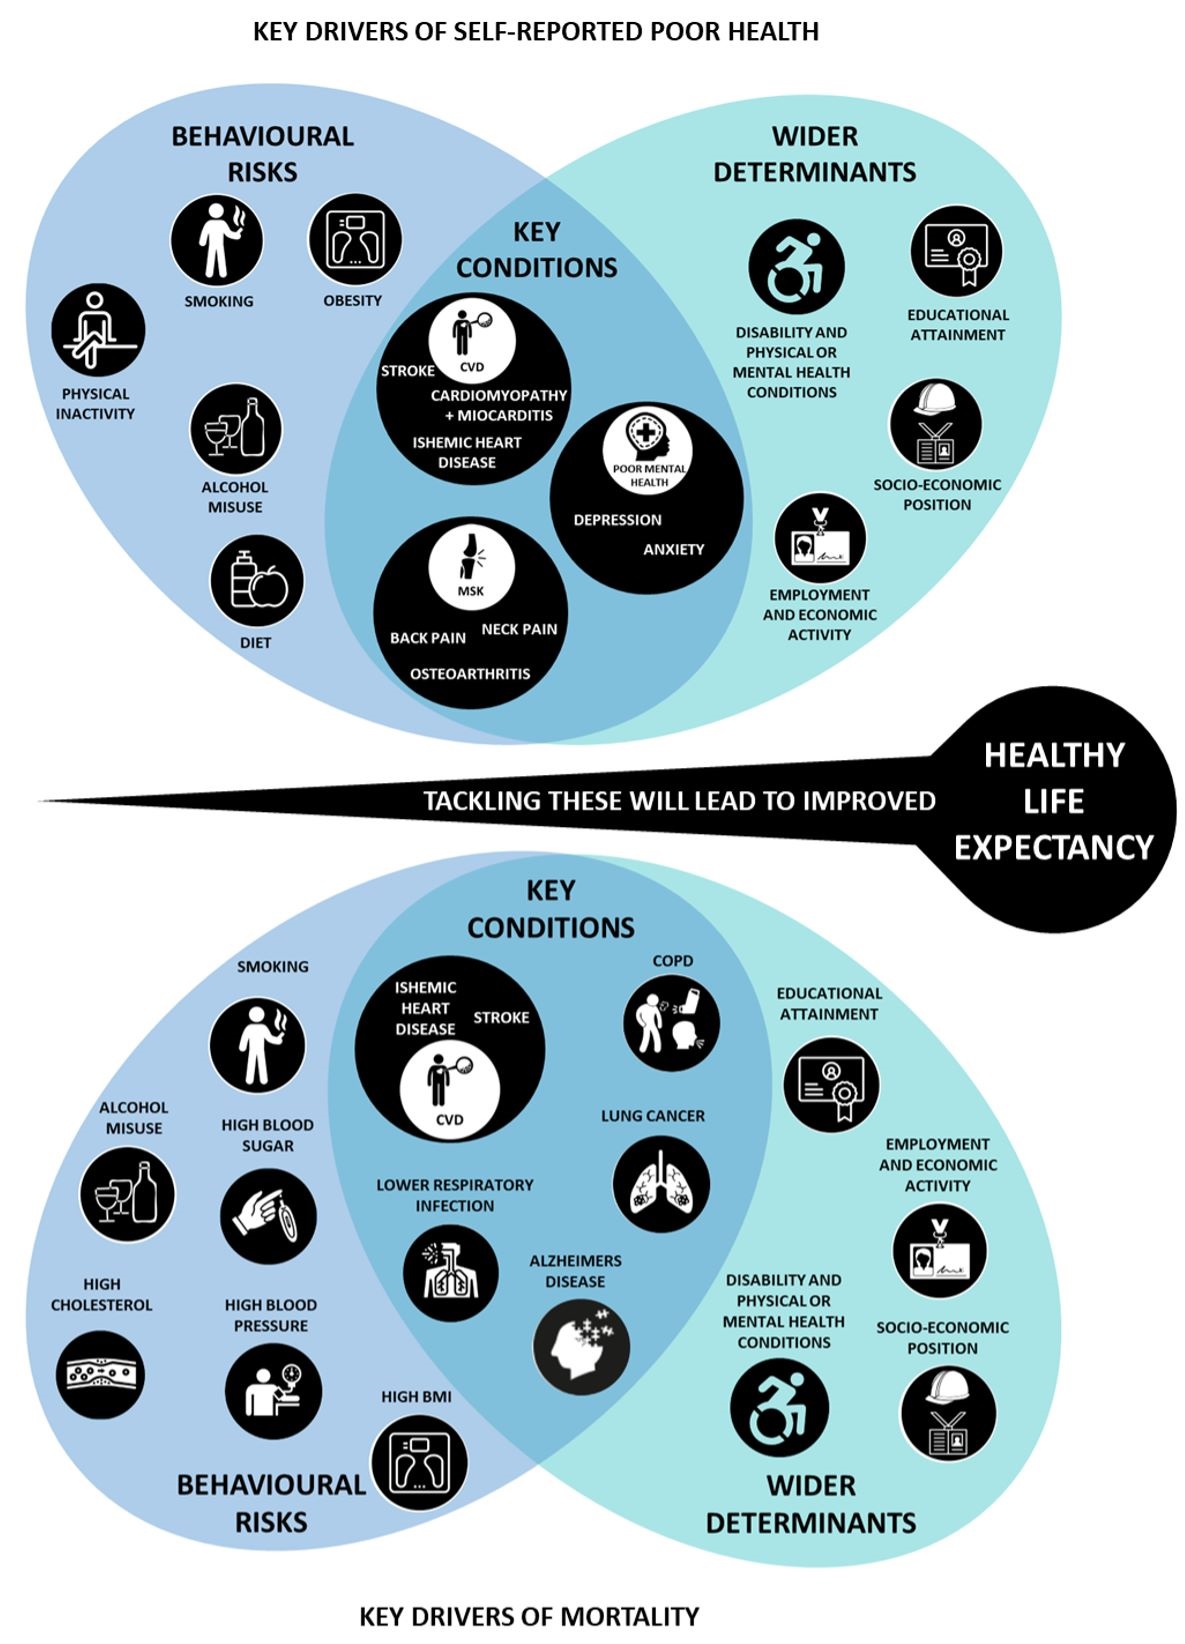
- Chronic conditions and multimorbidity reduce HLE: chronic health conditions and multimorbidity are the clearest drivers reducing healthy life expectancy. These include conditions of the musculoskeletal system, the heart and circulatory system and the nervous system (mental health conditions, brain conditions and pain) including dementia, as well as mental disorders, respiratory conditions, and lung cancer.
- Behavioural factors are associated with reduced HLE: Key behavioural factors associated with low healthy life expectancy include smoking, obesity, physical inactivity, alcohol misuse, and diet.
- Wider determinants also impact on HLE: Wider factors impacting on low healthy life expectancy include socio-economic position, employment and economic activity, disability and health conditions and educational attainment
We can extend years lived in good health by enabling healthy behaviours and reducing risk and impact of chronic disease and ill-health.
Recommendations
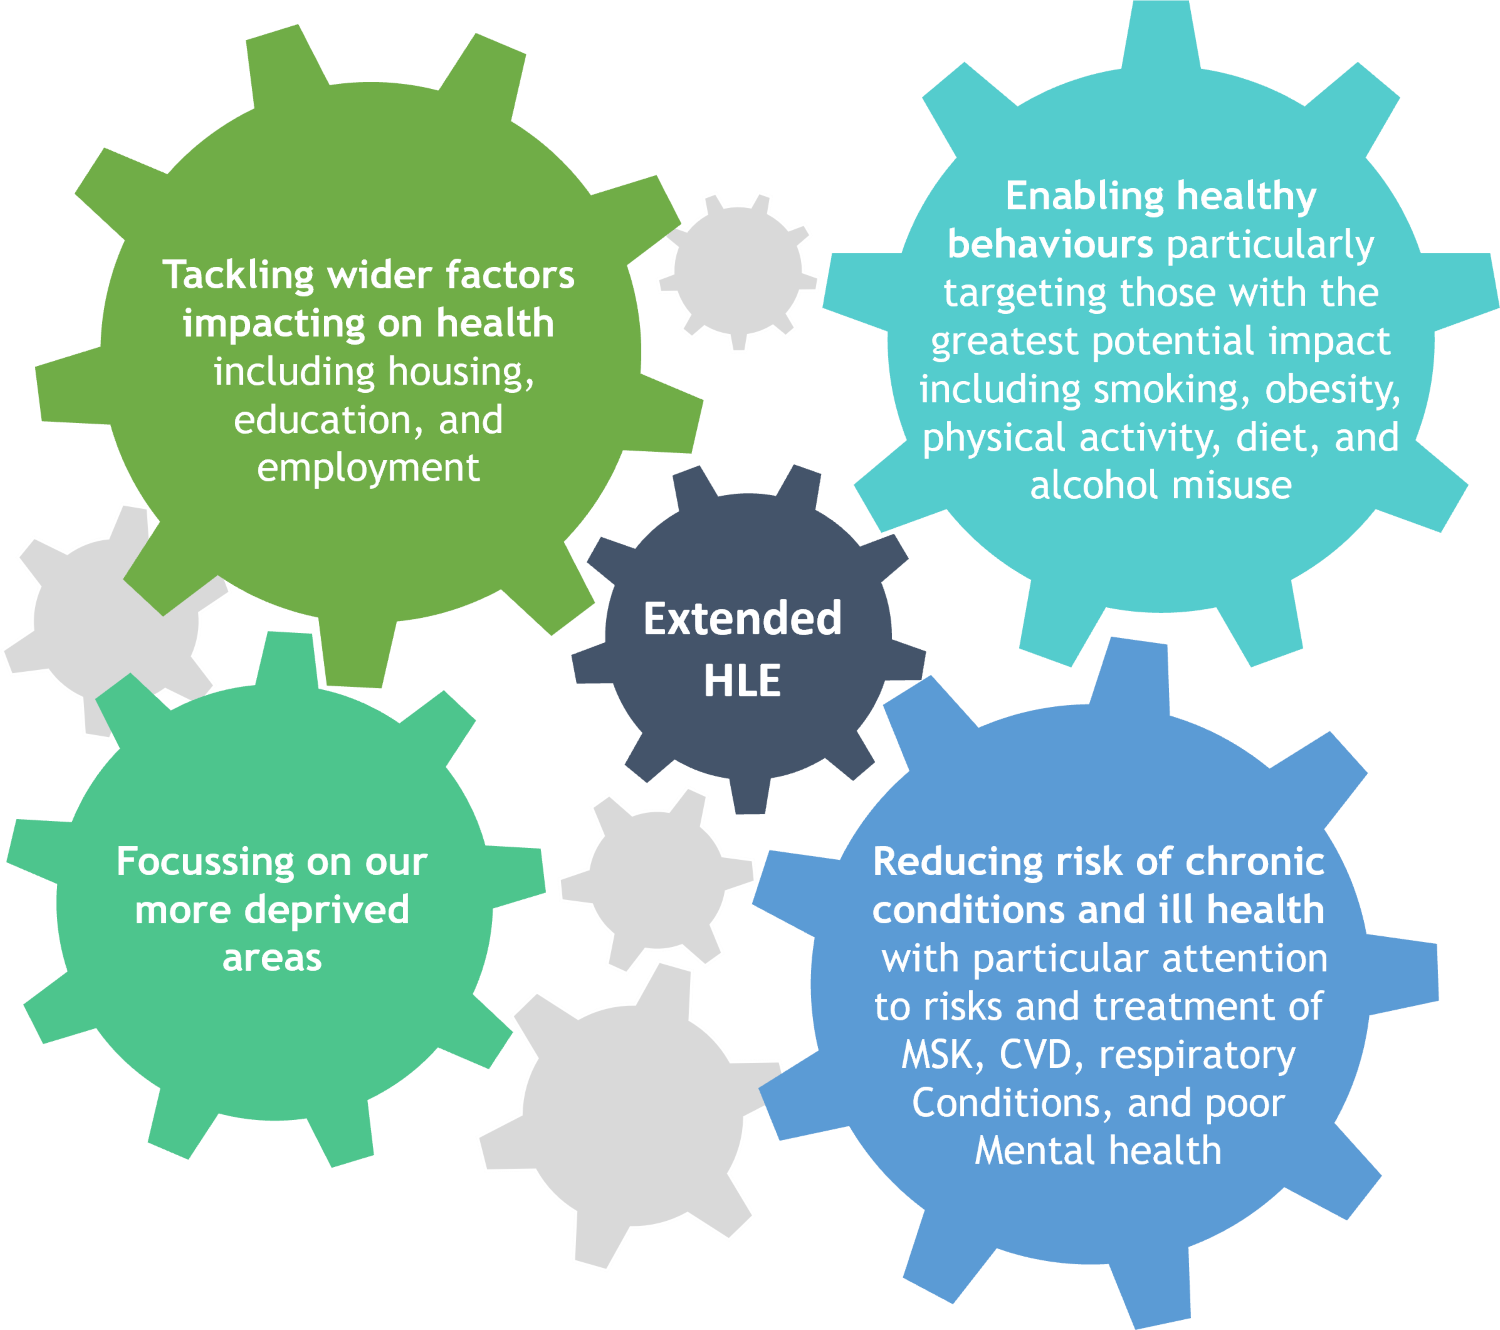
We can extend the years people live in good health in East Sussex by:
- Tackling wider factors impacting on health, including housing, education, and employment
- Enabling healthy behaviours, particularly targeting those with the greatest potential impact including smoking, obesity, physical activity, diet, and alcohol misuse
- Focusing on our deprived areas
- Reducing risk of chronic conditions and ill health, with particular attention to risks and treatment of MSK, CVD, respiratory conditions, and poor mental health
What is Healthy Life expectancy and how is it measured:
Healthy life expectancy (HLE) as a measure adds a quality of life dimension to LE estimates (how long a person is expected to live):
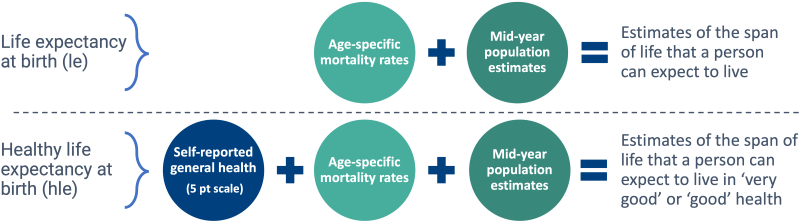
Healthy life expectancy at birth is an estimate of the average number of years babies born this year would live in a state of ‘good’ general health if [current] mortality levels at each age, and the level of good health at each age, remain constant in the future.
OHID (2023) Understanding the drivers of healthy life expectancy
Data on self-reported health status from large surveys, such as the Census, is combined with mid-year population estimates and age-specific mortality rates to produce estimates of the span of life that a person can expect to live in “very good” or “good” health (HLE). This calculation is used to estimate the prevalence of good health and mortality among those living in an area at a specific time period, assuming that a person’s mortality risk at each age throughout their life will remain the same as the current population in each age group. This also allows us to estimate the average number of years lived in poor health, by taking away the average years lived in good health (HLE) from the average life expectancy (LE) for an area.
While we have robust local data on self-reported health status from the 2021 Census, it needs to be noted that this data is only available every ten years. The fact the information is not timely will have important policy implications for actions to improve HLE.
How are we doing in East Sussex:
In the latest published time period (2018-2020) HLE for males in East Sussex is the same as for England (63.1 years), while HLE for females (63.3) is slightly below the national (63.9) However, female HLE has increased from a drop in 2017-19 which was the lowest it had been for 10 years.
A more, up-to-date (2020-2022) HLE has been calculated locally using Census 2021 data, as well as for East Sussex districts and boroughs. Please note that due to differences in data sources and methodology, these locally calculated HLEs cannot be compared to national figures or historical trend data.
Healthy Life Expectancy at birth in East Sussex – 2009/11 to 2018/20, males and females
NB: note axis starts at 60
For both males and females HLE is highest in Wealden and lowest in Hastings. The gap between these areas is 8.8 years for males and 8.1 years for females.
Healthy Life Expectancy at birth for males in East Sussex – 2020 to 2022 (local calculation using Census 2021 general health data)
Healthy Life Expectancy at birth for females in East Sussex – 2020 to 2022 (local calculation using Census 2021 general health data)
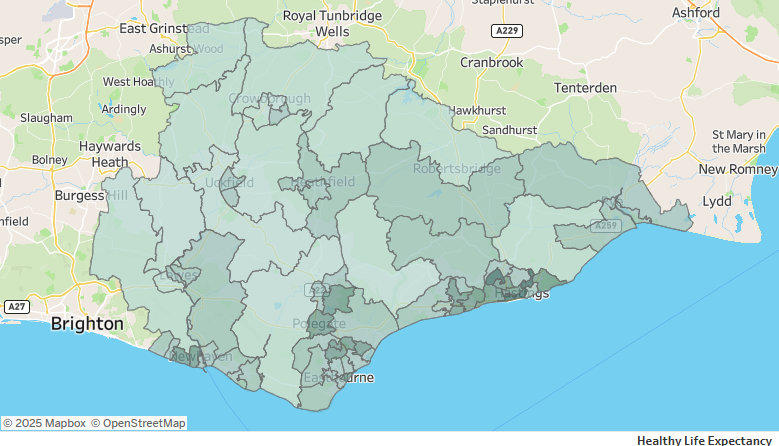
Healthy Life Expectancy at birth – 2009 to 2013 – East Sussex MSOA
View the East Sussex Healthy Life Expectancy Dashboard – escc.gov.uk
MSOAS with highest and lowest HLE Males
| LA (highest) | Highest HLE | LA (lowest) | Lowest HLE | |
|---|---|---|---|---|
| Wealden | Frant & Groombridge (73.3) | Hastings | Broomgrove (53.9) | |
| Wealden | Forest Row & Coleman’s Hatch (72.9) | Hastings | Central St Leonards (53.9) | |
| Lewes | Wivelsfield Green, Ditchling & Rodmell (72) | Hastings | Hollington (53.9) | |
| Wealden | Buxted, Framfield & Rotherfield (71) | Hastings | Central Hastings (56.7) | |
| Wealden | Mayfield & Wadhurst (70.9) | Eastbourne | Pier (57.0) | |
| Wealden | Five Ash Down, Horsted & Chiddingly (69.8) | Rother | Bexhill Central (57.4) | |
| Wealden | Crowborough North East (69.8) | Hastings | Braybrooke & Bohemia (58.1) | |
| Wealden | Herstmonceux & Ninfield (69.7) | Eastbourne | Langney West (60.2) | |
| Wealden | Chelwood & Nutley (69.7) | Rother | Bexhill North & Sidley (60.4) | |
| Lewes | Chailey, Newick & Barcombe (68.7) | Lewes | Newhaven West (60.6) | |
MSOAS with highest and lowest HLE Females
| LA (highest) | Highest HLE | LA (lowest) | Lowest HLE |
|---|---|---|---|
| Wealden | Frant & Groombridge (74.7) | Hastings | Central St Leonards (55.5) |
| Lewes | Wivelsfield Green, Ditchling & Rodmell (74.2) | Hastings | Hollington (55.8) |
| Wealden | Crowborough North East (73.9) | Hastings | Broomgrove (56.2) |
| Wealden | Mayfield & Wadhurst (73.7) | Hastings | Central Hastings (59.5) |
| Wealden | Forest Row & Coleman’s Hatch (72.9) | Hastings | Braybrooke & Bohemia (60.1) |
| Wealden | Buxted, Framfield & Rotherfield (72.6) | Rother | Bexhill North & Sidley (60.2) |
| Wealden | Crowborough Whitehill & Warren (71.6) | Eastbourne | Langney West (61.0) |
| Rother | Robertsbridge, Hurst Green & Ticehurst (71.4) | Rother | Bexhill Central (61.2) |
| Lewes | Chailey, Newick & Barcombe (71.2) | Eastbourne | Hampden Park North (61.3) |
| Wealden | Chelwood & Nutley (70.9) | Hastings | Ore (61.4) |
At a small area level (MSOA) there is a 19.4 year difference between the MSOA with the highest and the MSOA with the lowest HLE. For females this difference is 19.2 years. For both males (73.3) and females (74.7) HLE is highest in Frant and Groombridge and lowest in Central St Leonards (53.9 years for males and 55.5 for females), as well as in Hollington for males (53.9)
Areas with the lowest and highest Healthy Life Expectancy (2009-2013) and Life Expectancy in those areas (2016-2020) – East Sussex MSOA
There are inequalities across East Sussex in terms of how long people are living, and how much of their life they are living in good health.
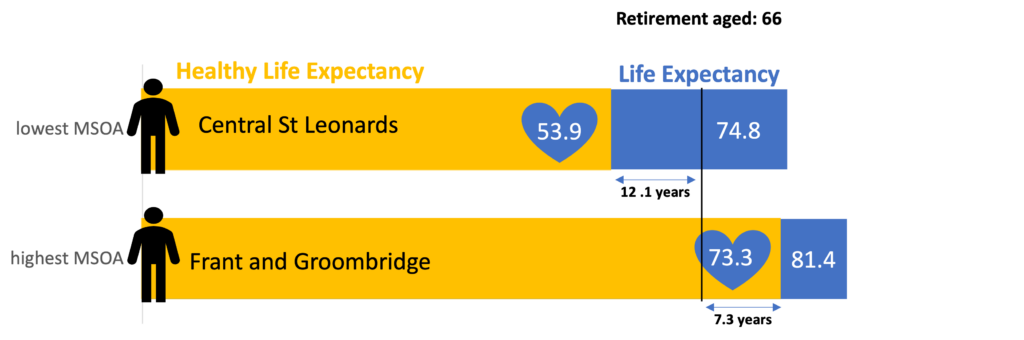
On average, a woman living in Central St Leonards will have experienced nearly 11 years in poor health by the time they retire.
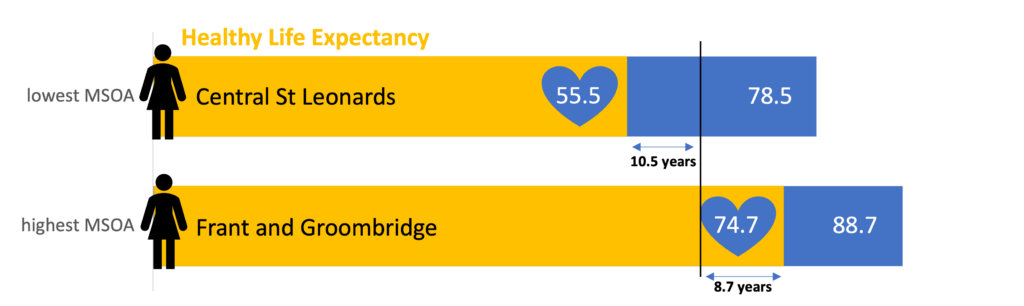
This compares to the average woman living in Frant and Groombridge living nearly 9 years of their retirement in good health.
Healthy Life Expectancy by deprivation
On average, people living in the most deprived communities in England have over 18 years less of their lives in good general health than those living in the least deprived areas. In East Sussex, this gap is 14.9 years for males between the most and least deprived quintiles[Footnote 1], and 13.4 years for females.
Healthy life expectancy in East Sussex has increased from 2011 to 2021 in males across all deprivation quintiles. For females, healthy life expectancy in 3 out of 5 quintiles (including the most and least deprived areas) has slightly decreased in 2021. Also, for the first time, in 2021 healthy life expectancy for those in the least deprived areas was higher in males than females.
Healthy Life Expectancy by deprivation quintile – males 2011 and 2021
Healthy Life Expectancy by deprivation quintile – females 2011 and 2021
What affects our healthy life expectancy:
In June 2023, the Office for Health Improvement and Disparities (OHID) published a report Understanding the drivers of healthy life expectancy looking at the key drivers of HLE in the UK to inform work towards their priority to improve HLE nationally. Key findings from the report include that:
- changes in self-reported good health prevalence have a larger impact on HLE than changes in mortality rates:
- if self-reported health prevalence remained constant but mortality rates improved by 2% from 2017 to 2019 levels, HLE would increase by 1 years
- if mortality rates remained constant but self-reported health prevalence improved by 2% in all age-groups, HLE would increase by 1.3 years

Analysis of mortality rates between 2011-2013 and 2017-2019 show that improving mortality rates contributed to improved HLE. However, throughout this time period for females, and between 2014-2016 and 2017-2019 for males, worsening of self-reported good health prevalence offset these improvements and led to overall worsening of HLE. The OHID report research looked at the drivers of both self-reported health status and mortality rates to help identify how HLE may be improved.
The next section will look in more detail at key factors affecting HLE, outlining what HLE looks like in East Sussex and what is driving it.
Self-reported health status
What conditions are associated with poor self-reported health:
The OHID publication on key drivers of HLE outlined the health conditions, behavioural factors, and socioeconomic factors most associated with self-reported poor health.
Health conditions and self-reported health
Both the research literature and statistical analysis of survey data have identified chronic health conditions and multimorbidity as the clearest drivers of self-reported poor health. Conditions of the musculoskeletal system (MSK) are highlighted as potentially warranting particular attention due to the high estimated population prevalence (17.2%) and research which suggests a 3x greater likelihood of self-reported poor health in those with chronic MSK compared to those without.
Chronic health conditions have the most consistent and strongest associations with self-reported poor health, along with multimorbidity. Some evidence also suggests a marked association between self-reported poor health and poor recent wellbeing and mental ill-health. Having a chronic condition has been found to significantly increase the odds of self-reported health poor health, and having multiple chronic conditions increases these odds even further. However, the strength of the association between different conditions and self-reported poor health has been found to vary significantly. The prevalence of the condition will also affect its potential overall influence on population-level healthy life expectancy (HLE).
The evidence shows that some health conditions have a greater effect on self-reported poor health but are less prevalent, while some have a smaller effect but are more prevalent so may have more impact on HLE at population level. The conditions estimated to have the strongest association (odds ratio[Footnote 2]) with self-reported poor health are shown in the chart below (left hand side), along with the weighted statistic (right hand side) showing the prevalence of the condition multiplied by the odds ratio. The ONS (Office for National Statistics) calculated this as a method of ranking the potential impact of the conditions on self-reported poor health. The prevalence in the table below is calculated from responses to questions about long term conditions in the 2016 Health Survey for England.
Conditions estimated to have a strong association with self-reported poor health (SRPH)

This evidence suggests that conditions of the musculoskeletal system, heart and circulatory system and nervous system have the greatest potential impact on population-level healthy life expectancy, followed by mental disorders and respiratory conditions. Along with the conditions highlighted above, the OHIC report also cited some evidence that diabetes has a significant and consistent association with self-reported poor health.
In 2023 the Department of Health and Social Care published the Major Conditions Strategy to meet the challenge of longer life expectancy meaning that many people are living years in poor health. The strategy focuses on the six major health conditions that together account for over 60% of ill health and early death in England: cancer, dementia, musculoskeletal disorders, chronic respiratory disease, cardiovascular disease and mental ill health. The conditions identified in the strategy support those identified by the OHID study as having the strongest association with self-reported poor health. According to the Major Conditions Strategy, one in 4 adults has at least 2 health conditions, and it is estimated that by 2035, two-thirds of adults aged over 65 will have 2 or more conditions and 17% will have 4 or more.
Health conditions, self-reported health, and the Global Burden of Disease
Analysis by East Sussex Public Health Intelligence reviewed the national evidence of health conditions associated with poor self-reported health alongside data from the Global Burden of Disease (GBD). This analysis concentrated on 50-69 year olds as it is within this cohort that estimated HLE in East Sussex falls. The GBD is an international tool looking at the prevalence of a condition and the relative harm caused, including an estimation of the years of life lived with any short-term or long-term health loss (years lived with disability, YLD). According to GBD, in 2021 in East Sussex, musculoskeletal disorders, mental health disorders, diabetes/chronic kidney disease, other non-communicable disorders including oral and endocrine disorders, and neurological disorders for 65% of total YLD. However, while this tells us about the presence or absence of disease or disability, it does not identify if those people who have these conditions would say they are experiencing poor health. Of these conditions, musculoskeletal disorders, mental health disorders (particularly depression), neurological disorders (particularly migraine) and diabetes are most closely associated in the literature with self-reported poor health.
The local review of the national literature also identified coronary heart disease as associated with self-reported poor health, with the most predominant diseases being atrial fibrillation and myocardial infarction.
Wider factors associated with self-reported health
The OHID research also considers wider behavioural and socio-demographic factors associated with self-reported poor health. While this information does not identify how much impact these factors may have on someone’s likelihood of self-reporting poor health, we can use this information to help target geographical areas where overall people more likely to be in poor health.
Self-reported poor health is also associated with behavioural and socioeconomic risk factors including physical activity, smoking status, education and household income and the complex relationship between risk factors such as these and physical health status. A strong association has also been identified between adverse health events, healthcare use and all-cause mortality and poor self-reported health.
Behavioural factors and self-reported health
Increased physical activity was found to have the most robust and consistent association with lower self-reporting of poor health, even when potential confounding factors are accounted for. There is also evidence of associations between poor self-reported health and smoking, overweight and obesity, although the evidence for overweight and obesity is less robust.
Socio-demographic factors and self-reported health
Whilst the association between wider determinants of health and self-reported health has been studied less in the literature, there is some consistent evidence that demographic factors and socioeconomic status are risk factors for self-reported poor health. This information is crucial to helping to target geographical areas where overall people are more likely to be in poor health.
The evidence suggests that high educational attainment is associated with self-reported good health, while poor housing, inadequate work and social exclusion are associated with poor self-reported health. However, the evidence for the UK is not always consistent with international evidence. For example, in opposition to international evidence, in England males have been identified as more likely to report poor health than females.
Analysis by the Office of National Statistics in 2017 linked national data sets for over 500,000 people since 1971 to explore differences in wider factors which influence our health between the areas with the highest healthy life expectancy and those with the lowest healthy life expectancy. The evidence showed that, compared to those in the areas with the highest healthy life expectancy, those in the lowest healthy life expectancy areas experience inequalities in:
Components of HLE in East Sussex: Self-reported health
In 2011 and 2021 the Census included the question ‘How is Your Health in General: very good, good, fair, bad, very bad.’ Similarly to nationally, self-reported poor health decreased in East Sussex between the 2011 and 2021 censuses. In 2021, a slightly lower proportion of the population reported that they were in ‘bad’ or ‘very bad’ health (5.1%) than nationally (5.3%). However, there is significant variation within the county, with higher reporting of poor health in Hastings and Eastbourne. Poor self-reported health in both 2011 and 2021 was nearly twice as prevalent in Hastings than Wealden.
Age-standardised proportion of the population who self-reported they were in ‘bad’ or ‘very bad health’ – 2011 and 2021
Age-standardised proportion of usual residents by self-reported health – 2011 and 2021
All Districts and Boroughs have seen a rise in those reporting ‘very good’ health compared to 2011, and all have seen a decrease of those reporting ‘good’, ‘fair’, ‘bad’ or ‘very bad’ health, except for Eastbourne where there is a slight rise in those reporting they are in ‘bad’ health. Hastings and Eastbourne have higher proportions reporting they are in ‘bad’ or ‘very bad’ health than Lewes, Rother, and Wealden.
Population reporting bad or very bad health, 2021 Census, MSOAs
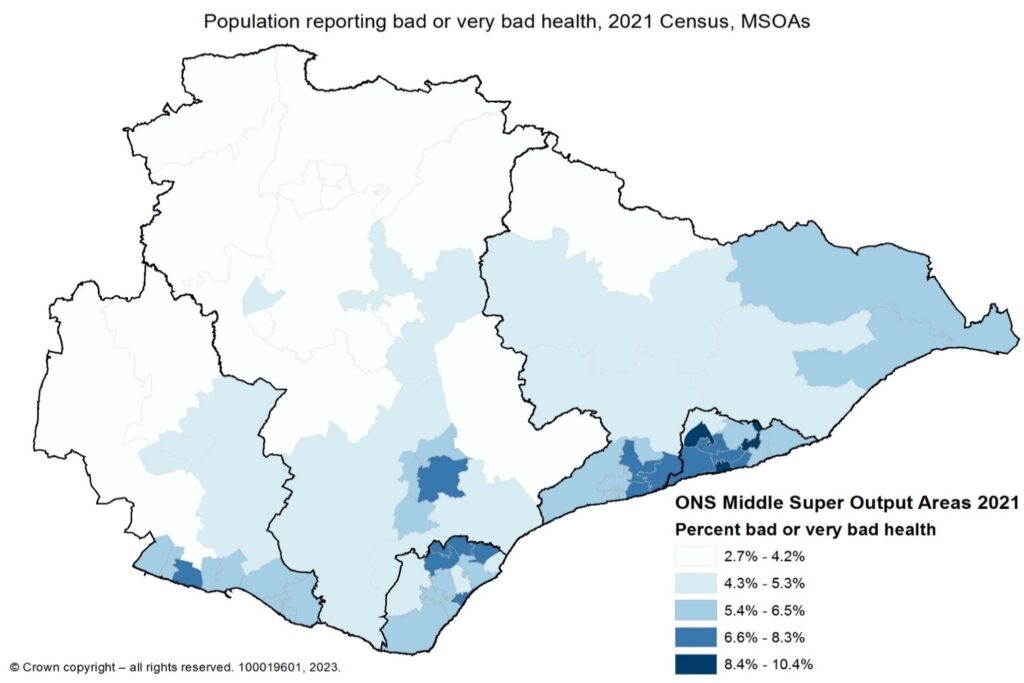
Of the ten areas with the highest bad/very bad health in 2011, 8 remained in the top ten in 2021. These are Hollington, Broomgrove, Central St Leonards, Hampden Park South, Bexhill Central, Bexhill East & Pebsham, Central Hastings and Peacehaven East.
| Top ten areas with highest bad / very bad health |
|---|
| Top 10 | 2011 | 2021 |
|---|---|---|
| 1 | Central St Leonards (10.5%) | Hollington (10.4%) |
| 2 | Hollington (10.1%) | Broomgrove (9.4%) |
| 3 | Bexhill Central (9.3%) | Central St Leonards (9.1%) |
| 4 | Broomgrove (9.1%) | Bexhill North & Sidley (8.3%) |
| 5 | Bexhill East & Pebsham (8.8%) | Hampen Park South (7.8%) |
| 6 | Peacehaven East (8.6%) | Bexhill Central (7.8%) |
| 7 | Langney East (8.1%) | Bexhill East & Pebsham (7.7%) |
| 8 | Central Hastings (8.0%) | Langney West (7.6%) |
| 9 | Upperton (7.9%) | Central Hastings (7.2%) |
| 10 | Hampden Park South (7.7%) | Pecehaven East (7.2%) |
| Top ten areas with lowest bad / very bad health |
|---|
| Top 10 | 2011 | 2021 |
|---|---|---|
| 1 | Frant & Groombridge (2.9%) | Frant & Groombridge (2.7%) |
| 2 | Crowborough North East (2.9%) | Crowborough North East (3.0%) |
| 3 | Buxted, Framfield & Rotherfield (2.9%) | Chelwood & Nutley (3.3%) |
| 4 | Five Ash Down, Horsted & Chiddingly (3.1%) | Chailey, Newick & Barcombe (3.6%) |
| 5 | Forest Row & Coleman’s Hatch (3.2%) | Forest Row & Coleman’s Hatch (3.6%) |
| 6 | Uckfield South (3.3%) | Uckfield South (3.6%) |
| 7 | Mayfield & Wadhurst (3.5%) | Mayfield & Wadhurst (3.7%) |
| 8 | Robertsbridge, Hurst Green & Ticehurst (3.5%) | Buxted, Framfield & Rotherfield (3.8%) |
| 9 | Chailey, Newick & Barcombe (3.6%) | Five Ash Down, Horsted & Chiddingly (3.8%) |
| 10 | Wivelsfield Green, Ditchling & Rodmell (3.6%) | Crowborough South East (3.8%) |
Percentage of residents reporting bad or very bad health between 2011 Census and 2021 Census, MSOAs in East Sussex with district/borough in brackets
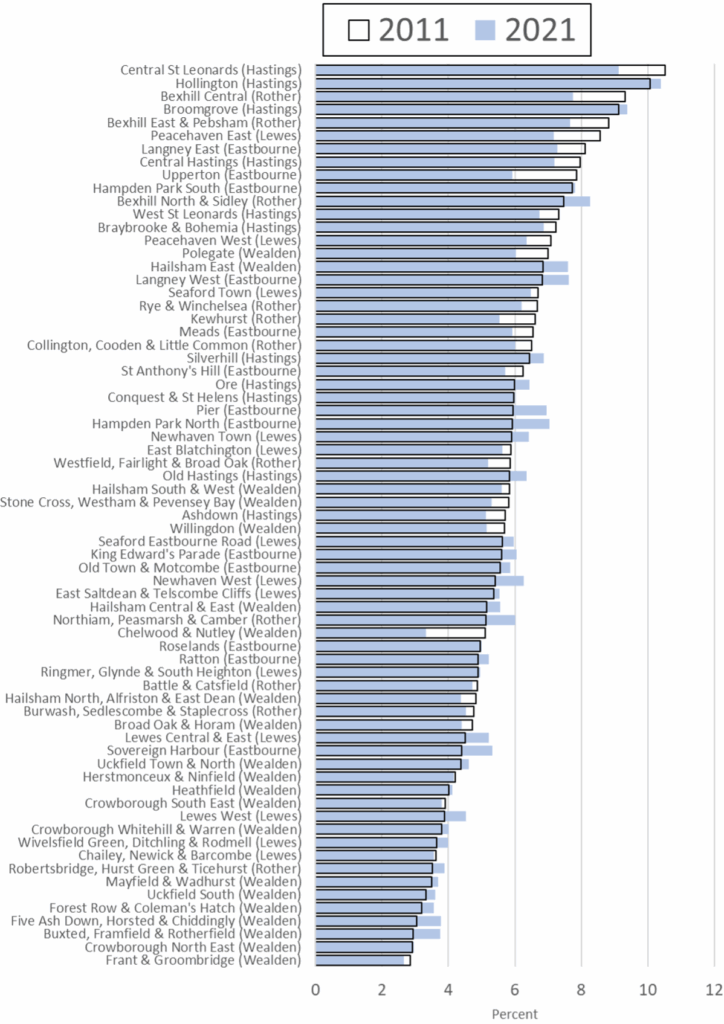
This chart shows the percentage of residents in each of the 69 MSOAs in East Sussex who reported being in bad or very bad health for the last two Census’. The chart is ordered by the 2011 percentage (outline) and the blue bar shows the 2021 percentage. The situation has improved in MSOAs where the blue bar is now below the outline. The situation has deteriorated for those where the blue bar is above the outline. Of the nine MSOAs with the poorest self-reported health in 2011, all but two areas have improved. Hollington and Broomgrove (both in Hastings) have seen a slight deterioration. There is no correlation at MSOA level when comparing change in those reporting bad health between 2011 and 2021 and deprivation score.
Analysis of bad / very bad health, Census 2021
Many different aspects of individuals lives contribute to poor health, often with these factors compounding each other to exasperate poor outcomes further. This section attempts to show just some of these effects by looking at the percentage of the population who self-reported bad or very bad health (also described as poor health) in the 2021 Census by age group and some of the wider determinants of health.
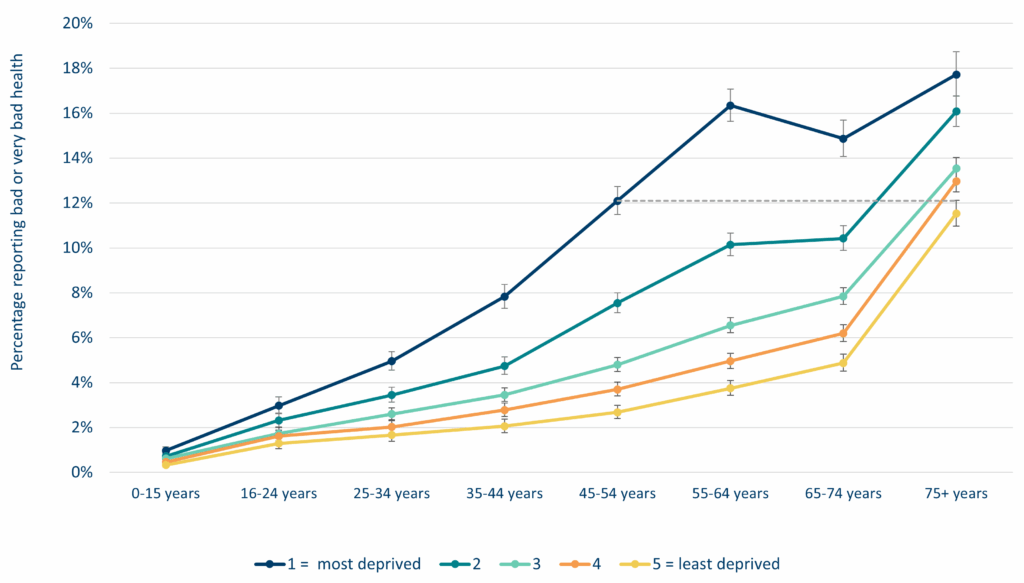
Across all age groups, increasing levels of deprivation consistently lead to significantly increasingly higher percentages of the population self-reporting bad/very bad health. In the most deprived areas of East Sussex, a higher percentage of 45-54 year olds report bad/very bad health than persons aged 75 years or over in the least deprived areas of the county (12.1% vs 11.5% respectively).
Percentage of residents reporting bad or very bad health by age group and deprivation (National IMD 2019 quintiles), East Sussex residents, Census 2021
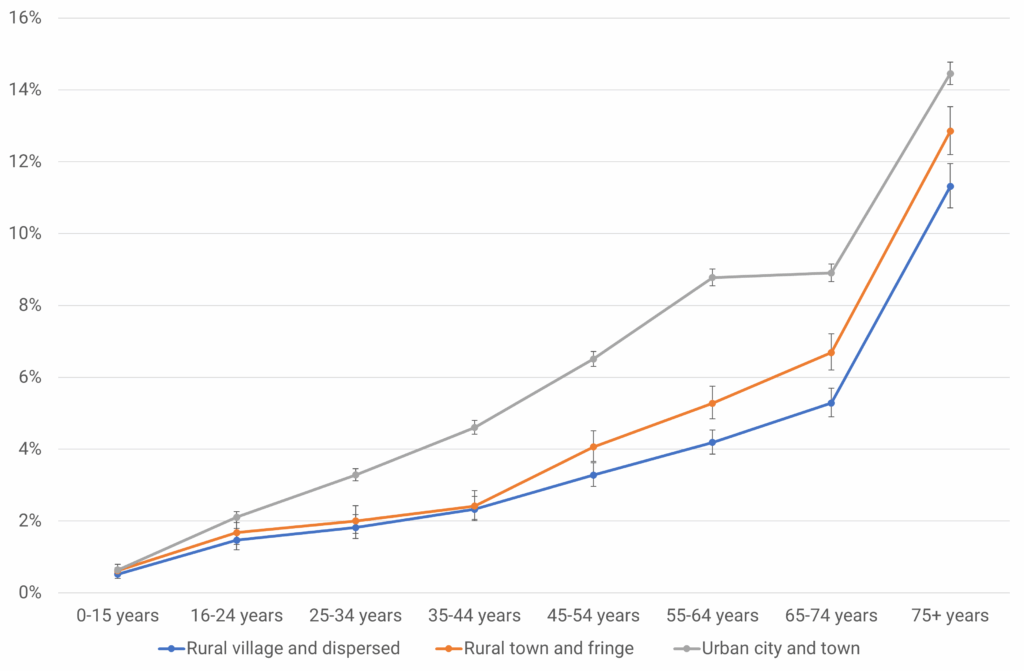
In East Sussex, the more rural an area, the lower the self-reported poor health, with higher poor health in urban areas (though deprivation tends to be more concentrated in urban areas). Within towns (slightly different definition to ‘urban’ areas), there are clear differences between coastal and non-coastal towns[Footnote 3]. Residents of coastal towns reported significantly higher percentages of bad/very bad health across all age groups (16+) compared to residents of non-coastal towns.
Percentage reporting bad/very bad health in East Sussex by urban/rural (2011) classification
Percentage reporting bad/very bad health in rural and coastal towns in East Sussex

There are differences in those reporting poor health between different ethnic groups in East Sussex. Across working ages, Asian/Asian British and Black/Black British have significantly lower self-reported poor health compared to white ethnicities, whereas for mixed/multiple ethnic groups poor health is significantly higher in those of working age when compared to white ethnic groups. In under 16s and persons aged 65-74 years poor health is significantly worse for other ethnic groups than those of white ethnicities. Once you reach the age of 75 years there are no significant differences in poor health between different ethnic groups.
| Age group | White | Asian, Asian British or Asian Welsh | Black, Black British, Black Welsh, Caribbean or African | Mixed or Multiple ethnic groups | Other ethnic group |
|---|---|---|---|---|---|
| 0-15 years | 0.6 | 0.3 | 1.3 | 0.6 | 1.7 |
| 16-24 years | 2 | 0.8 | 2.2 | 2.3 | 1.2 |
| 25-34 years | 3 | 0.9 | 0.7 | 4.1 | 2.3 |
| 35-44 years | 4.1 | 2.1 | 3.9 | 5.6 | 4.1 |
| 45-54 years | 5.8 | 3.1 | 4.2 | 8.7 | 5.6 |
| 55-64 years | 7.6 | 5.6 | 8.6 | 9.6 | 8.8 |
| 65-74 years | 8 | 6.7 | 6.4 | 8.3 | 12.2 |
| 75+ years | 13.8 | 14.1 | 17.2 | 16.4 | 19.2 |
| Colour | Group status |
|---|---|
| Green | Significantly better compared to White ethnic group |
| Amber | Similar to White ethnic group |
| Red | Significantly worse compared to White ethnic group |
Percentage reporting bad/very bad health in East Sussex by qualifications

For persons with no qualifications, poor health is significantly higher across all ages (25+) compared to those with any qualification.
Of the population with no qualifications, there are differences in the self-reported health across the county with 7% of the population with no qualifications reporting poor health in Frant and Groombridge compared to 22% in Hollington (not age-standardised).
Percentage of residents with no qualifications reporting bad or very bad health in 2021 by MSOA

When considering unpaid caring responsibilities, the percentage reporting poor health is highest in those who provide 50 or more hours a week unpaid care followed by those who provide 20 to 49 hours of unpaid care per week. Up to the age of 44 providing no unpaid care has the lowest poor health, however, beyond this age the lowest percentage of people reporting poor health in in those providing 19 or less hours unpaid care per week.
Percentage of residents reporting bad or very bad health by unpaid caring status, Census 2021

Analysis of GBD data in relation to the conditions which OHID identified as having the greatest potential impact on population-level healthy life expectancy (P12) shows that the specific diseases in East Sussex with the greatest potential impact on Disability Adjusted Life Years (DALYs) are ischemic heart disease, back pain, Alzheimer’s disease and other dementias and COPD. Overall, musculoskeletal conditions, heart and circulatory conditions and cancers are the greatest contributors to DALYs. However, while this tells us about the presence or absence of disease or disability, it does not identify if those people who have these conditions would say they are experiencing poor health.
Conditions affecting self-reported health in East Sussex
Diseases with the greatest contribution to disability adjusted life years (DALYS) in East Sussex, 2021
| Chronic Condition (OHID, 2023) | Diseases (GBD, 2021) | % of total DALYS (GBD, 2021) |
|---|---|---|
| Musculoskeletal system | Back pain | 4.36% |
| Osteoarthritis | 1.64% | |
| Neck pain | 1.27% | |
| Other musculoskeletal disorders | 1.70% | |
| Heart and circulatory system | Ischemic heart disease | 5.14% |
| Stroke | 3.19% | |
| Cardiomyopathy and myocarditis | 2.04% | |
| Atrial Fibrillation and flutter | 1.13% | |
| Nervous system (including dementia) | Alzheimer’s disease and other dementias | 3.50% |
| Headache disorders | 2.00% | |
| Parkinsons disease | 0.74% | |
| Multiple Sclerosis | 0.32% | |
| Mental disorders | Depression disorders | 2.94% |
| Anxiety disorders | 1.85% | |
| Bipolar disorder | 0.64% | |
| Schizophrenia | 0.43% | |
| Respiratory system | Chronic Obstructive Pulmonary Disease | 3.48% |
| Asthma | 1.14% | |
| Interstitial Lung disease and pulmonary sarcoidosis | 0.65% | |
| Endocrine and metabolic | Diabetes mellitus | 2.61% |
| Chronic kidney disease | 1.18% | |
| Digestive system | Cirrhosis | 1.04% |
| Upper digestive system diseases | 0.64% | |
| Gallbladder and biliary diseases | 0.57% | |
| Neoplasms and benign growths | Tracheal, bronchus and lung cancer | 3.09% |
| Colon and rectal cancer | 2.07% | |
| Breast cancer | 1.62% | |
| Prostate cancer | 1.38% | |
| Genito-urinary system | Oral disorders | 1.23% |
| Gynaecological disease | 1.20% | |
| Sensory | Hearing loss | 1.93% |
| Blindness | 0.88% |
Overall, the evidence in this briefing suggests that for East Sussex, key drivers of self-reported health are:
Mortality
All age all-cause mortality in East Sussex has significantly increased in 2020-2022 from 2010-2012. This is the case for both males and females and across all deprivation quintiles. This is due to the mortality experienced as a result of the Covid-19 pandemic. These high mortality rates will have an impact on the healthy life expectancy calculations when updated by ONS.
Wider factors associated with mortality
There are also wider factors that impact on mortality risk. Building on findings from the 2010 Marmot review, ONS wider determinants of health research on the lifestyle and wider characteristics linked to healthy life expectancy highlights the relationship between unemployment and raised mortality and premature mortality risk, as well as differences in mortality rates depending on socio-economic position. The analysis demonstrated marked variation in mortality rates depending on current or previous occupational circumstances, including parental occupation impacting on the mortality rate of their children. Educational attainment and disability and chronic illness also significantly impact on life expectancy in the UK. Higher levels of education are associated with greater social mobility, fewer co-morbidities and longer life expectancy, with recent research showing an average 1.9% reduction in all-cause adult mortality risk associated with education [Endnote 8],[Endnote 9]. Disability and chronic physical and mental illness are strongly associated with shorter life expectancy.
Analysis by the ONS also identifies alcohol consumption as one of the leading lifestyle risk factors for disease and death in the England, contributing to a range of conditions which impact on hospital admissions and death rates. The latest statistics for England show that there were 1,116 potential years of life lost due to alcohol-related conditions per 100,000 males in 2020, and 500 potential years of life lost per 100,000 females. In East Sussex in 2020 there were 1,041 potential years of life lost due to alcohol-related conditions per 100,000 males, and 336 potential years of life lost per 100,000 females.
Components of HLE in East Sussex: Mortality
What conditions are associated with mortality:
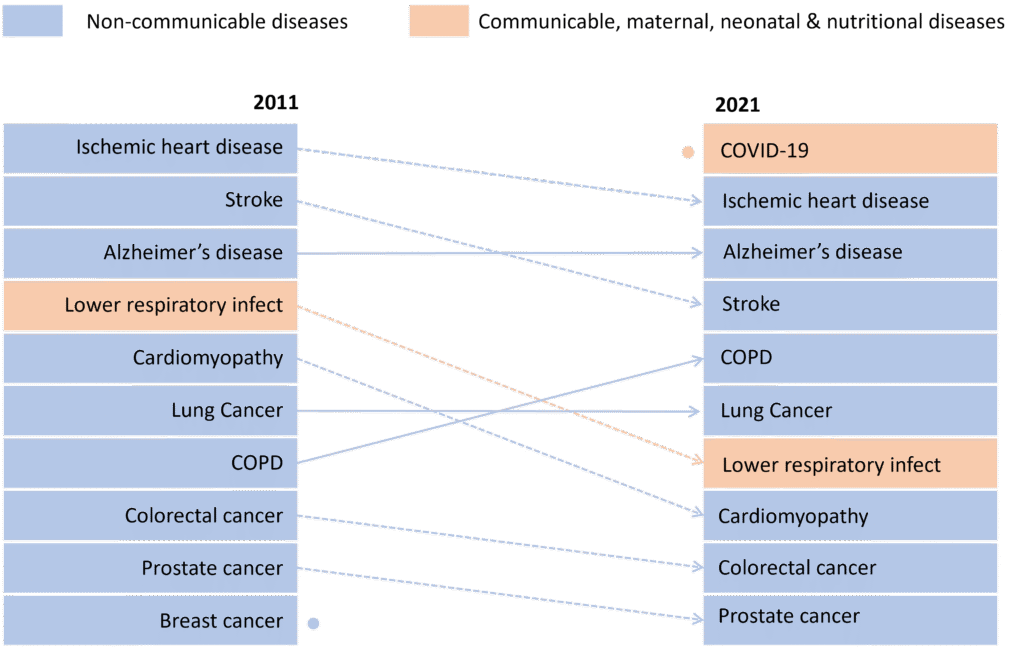
The data below shows the top 10 causes of death and risks for death in East Sussex. This data is taken from the Global Burden of Disease (GBD) and shows modelled data. The most recent data is for 2021 and therefore shows COVID-19 as the number one cause of death. After COVID-19, according to the GBD, in East Sussex the top causes of death (all ages, both sexes) are Ischemic heart disease, Alzheimer’s and stroke, with little change in top causes of death between 2011 and 2021. During the pandemic people who may have died from another cause, died earlier from COVID-19 instead. The GBD does show most causes had a lower mortality rate in 2021 compared to 2011. The only exception is prostate cancer where the rate increased very slightly in 2021 compared to 10 years previously, however not significantly so.
Top 10 causes of death in East Sussex: both sexes; all ages; death per 100,000
Wider factors associated with mortality in East Sussex
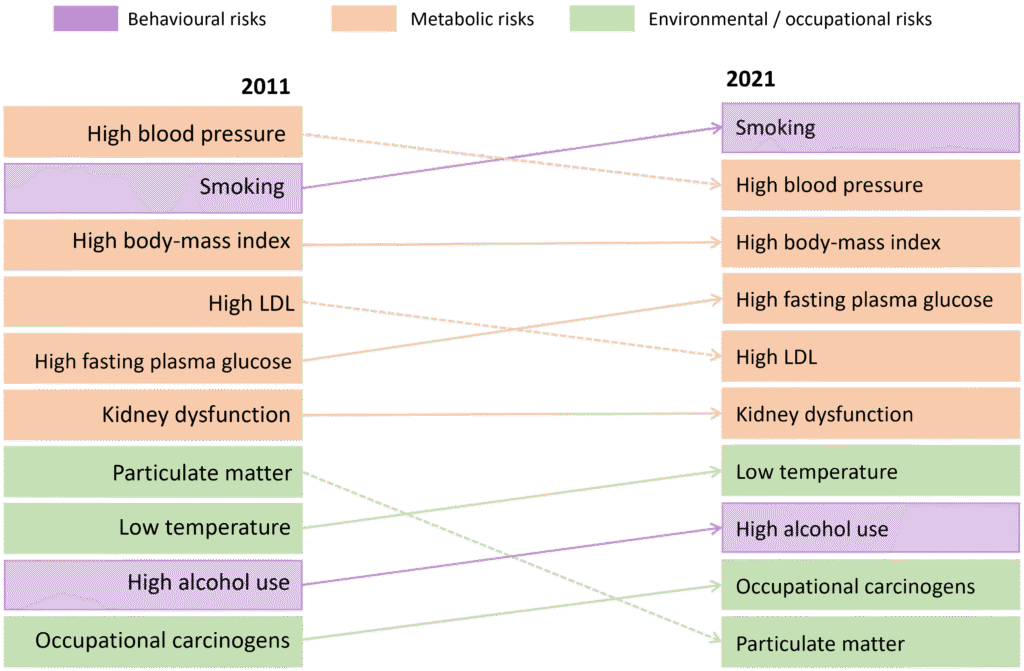
There are a number of other, often interlinked factors which increase mortality risk. The GBD also considers behavioural risks, metabolic risks and environmental/occupational risks associated with mortality. In East Sussex, smoking, high blood pressure and high body-mass index are the leading risks factors for death. There has been little change in top risks for death between 2011 and 2021. The rates for most risk factors has decreased in 2021 from 10 years previously with the exception of high fasting plasma glucose where the rate has increased, but not significantly so.
Top 10 risks for death in East Sussex: both sexes; all ages; death per 100,000
Overall, the evidence in this briefing suggests that for East Sussex, key drivers of premature mortality are:
What should we be doing:
The national OHID report recommends that to more effectively improve, and reduce the gap in healthy life expectancy, there needs to be a greater focus on improving the drivers of self-reported health as well as drivers of mortality rates. Better self-reported health is independently associated with improved all-cause mortality and thus improving self-reported health would also improve mortality.
The evidence suggests that to most effectively do this would mean:
- Particular attention being paid to preventing the onset and the effective clinical management of chronic conditions.
- Paying particular attention also to conditions which, if targeted, would have the greatest impact on HLE at population level: MSK and CVD. In East Sussex, the most prevalent conditions in these groups include back pain, neck pain and osteoarthritis (MSK) and stroke, cardiomyopathy and myocarditis and ischemic heart disease (CVD) and poor mental health.
- A focus on the relationship between behavioural risks and wider determinants –income, education, physical activity, smoking, and other factors all show associations with self-reported poor health.
- Consideration of the complex relationship between wider determinants of health, psychosocial risk factors, health-related behaviour, and physiological risk factors. Different exposures to psychosocial and material stressors, and to resources to cope with these can lead to varied health outcomes, including self-reported poor health.
- improvements in self-reported good health among older age groups – improvements in all age groups would impact on HLE, but the potential to increase HLE is larger among older ages because it is already relatively high in younger age groups.
How are we improving healthy life expectancy in East Sussex?
The following sections look at local actions to improve healthy life expectancy against the recommendations of action that should be taken outlined above from OHID. This includes considerations of future actions to meet any identified gaps.
Preventing the onset, and effectively clinically managing chronic conditions
Routine work of public health, wider local authority, and the NHS.
Much of the work of public health and wider local authority services, seeks to improve the building blocks of health[Endnote 10] to prevent onset of chronic conditions (primordial or primary prevention).[Footnote 4]
Routine work of the NHS includes the clinical management of chronic conditions. Programmes are in place to support services to do this in a way that reduces inequalities.
The Sussex health and care partnership strategy Improving Lives Together aims to support residents to live healthier for longer.
Examples of specific services commissioned by public health, or led by NHS partners seek to prevent chronic conditions, sometimes among those with existing risk factors.
CVD prevention – East Sussex CVD prevention steering group enables partners in East Sussex to work together to aid co-ordination of CVD prevention.
Programmes to reduce risk factors for chronic conditions – Public health also leads on programmes to reduce harm from smoking, alcohol, poor diets and physical activity.
NHS health checks – NHS health checks is a programme to identify individuals aged over 40 at risk of heart disease, diabetes, kidney disease and stroke. This includes providing individual advice on reducing risk or referring to services to offer specialist support or disease management.
Quality and Outcomes Framework (QOF) for primary care – The QOF rewards general practice for actions to promote health and reduce risk of chronic conditions.
Range of Locally Commissioned Services including e.g. ambulatory blood pressure monitoring, Atrial Fibrillation, Familial Hypercholesterolaemia.
Weight management services
Paying particular attention to the conditions which, if targeted, would have the greatest impact on population-level HLE: MSK and CVD
The delivery plan for the Sussex health and care partnership strategy
The delivery plan for the Sussex health and care partnership strategy identifies a priority action for East Sussex to improve health outcomes in CVD, respiratory disease, mental health and frailty/ageing, which are among the health conditions most likely to contribute to ill health in Sussex. A programme of work is underway to achieve this.
As outlined above, specific services are in place in East Sussex to prevent or reduce risk of CVD.
Tackling risk factors for MSK conditions
Risk factors for MSK conditions include physical inactivity, being overweight or obese, inadequate diets and smoking.
Public health leads partnerships which seek to prevent or reduce harm from these risk factors.
The East Sussex Wellbeing at Work programme also supports workplaces to support the health of their employees with a particular focus on mental health and MSK.
The Sussex MSK partnership provides an integrated MSK service to support residents of East Sussex to manage their conditions.
MSK services are commissioned by NHS Sussex. From December 2024 this will include a redesigned patient pathway
Focusing on the relationship between behavioural risks and wider determinants
Programmes to reduce harm from unhealthy behaviours
Public health leads on programmes to reduce harm from healthy behaviours including smoking, alcohol, poor diets and physical activity.
In particular, the alcohol harm reduction strategy, and whole system healthy weight plan set out priority actions to improve risk factors most likely to impact on mortality and self-reported poor health, and therefore healthy life expectancy in East Sussex. There is also work underway to create a local tobacco strategy.
Examples of health services include weight management, support to quit smoking, and alcohol care teams.
Considering the relationship between wider determinants of health, psychosocial risk factors, health-related behaviour, and physiological risk factors
Tackling wider risk factors
Varying exposure to psychosocial and material stressors can lead to differences in their effects on health status and outcomes, including self-reported poor health[Endnote 11]
Actions by the wider local authority seek to prevent or reduce the impact of psychosocial and material stressors e.g. children’s social care support, financial support, warm homes support.
The 2022/23 annual report of the Director of Public Health
The 2022/23 annual report of the Director of Public Health highlights the importance of social connections and the impact loneliness can have on people’s health and wellbeing. Among the recommendations is a call to action on preventing and tackling loneliness. The subsequent Loneliness Programme is a whole systems approach to tackling loneliness being led by the VCSE and funded by Public Health.
Improving self-reported good health among all ages with a focus on older age groups
Improving outcomes for older age groups: strategies and plans.
In addition to all the actions listed above which seek to improve self-reported good health among all ages, there are some specific work areas which specifically seek to improve outcomes for older people.
The delivery plan for the Sussex health and care partnership strategy identifies a priority action for East Sussex to improve outcomes in four priority areas, one of which is frailty/healthy ageing. The Delivery Plan sets out an intention to ‘help local people to age well, and an action plan to achieve this is in development.
Some specific services commissioned by public health, or led by local partners seek to improve outcomes for older people
Making it Happen is a 5.5 year VCSE-led programme funded by East Sussex Public Health until March 2025. Five local organisations work in partnership to deliver Asset Based Community Development to support people to make connections, initiate projects and activities, feel more connected to their local place, and bring local community assets into use. The programme, recognised nationally as good practice, includes projects particularly engaging older people, including Men’s Shed Bexhill, Just Friends (countywide), and Friends All Together in Rother.
Healthy Ageing through Innovation in Rural Europe | Haire – this three-year Project funded by the EU Interreg2Seas programme, was delivered locally in Rural Rother between 2019 and 2023 to look at new ways of co-producing healthy ageing and reducing loneliness strategies. In response, ESCC developed a new Life Transitions Service to help East Sussex residents prepare and cope with big transitions in later life.
Our Stories Our Songs is commissioned by public health to deliver creative health in residential care and community settings: specifically using music and arts based interventions to drive improved well being through use of Brain Health stimulating resources and techniques centred on singing, memory and communal connections and experiences.
Public Health are also looking to support the development of age friendly communities in East Sussex
The Adult Social Care strategy What Matters To You includes key action areas around improving health and wellbeing of people who have care needs, with a focus included in this on older people receiving care. Adult Social Care are also developing a prevention strategy and a Carers Partnership Plan.
Across the county, much support is provided by the VCSE sector to support older people to stay healthy. Other programmes of work which are available to all ages, may provide particular support to older individuals e.g. social prescribing.
Suggested recommendations for future developments: what else should we be doing
The content below outlines where further work could be undertaken across the East Sussex health and care system to better meet the actions to improve HLE as identified by OHID, given the work already in place (section above).
Preventing the onset, and effectively clinically managing chronic conditions
- Continue to acknowledge the importance of, and expand where possible, work to improve the building blocks of health throughout the life course such as healthy eating, physical activity, alcohol harm reduction and addressing psychosocial risk factors.
- Increase uptake of NHS Health Checks to maximise earlier identification of people at risk of heart disease, diabetes, kidney disease and stroke.
- Monitor the outcomes of NHS Health Check referrals to services or treatment to maximise their impact on risk of heart disease, with a focus on groups at greater risk.
- Increase awareness among residents of the risks of chronic physical and mental health conditions and how they can be supported to take appropriate action.
- Support a wide range of health and other professionals to support residents with behaviour change e.g. diet, physical activity, smoking, alcohol harm
- NHS providers can continue to take steps to ensure clinical pathways that manage chronic physical and mental health conditions do so in a way to reduce inequalities.
Paying particular attention to the conditions which, if targeted, would have the greatest impact on population-level HLE: MSK, CVD and poor mental health
Including 1-6 above
- Increase the number of workplaces in East Sussex working towards the Wellbeing at Work programme, particularly targeting support to settings with employees most at risk of MSK
- Support existing MSK services to maximise their support for patients with MSK problems, particularly groups experiencing disproportionate need.
- Work with wider employment programmes which support residents with their MSK and other health issues.
Considering the relationship between wider determinants of health, psychosocial risk factors, health-related behaviour, and physiological risk factors
Including 1 above
- Acknowledge the important role of local authority and VCSE partners in reducing psychosocial risk factors and therefore impact on healthy life expectancy. Maximise the ability of VCSE organisations to support residents and maintain or increase where possible, support for individuals and families e.g. through children’s social care support, financial support, warm homes support and other services.
- Maximise implementation of the loneliness programme of work subsequent to the 2022/23 annual report of the Director of Public Health
Improving self-reported good health among all ages with a focus on older age groups
Including 1-11 above
- Maximise impact of the developing Adult Social Care prevention strategy to support older residents to remain healthy
- Implement evidence-based healthy ageing interventions e.g. age friendly communities.
- Maximise delivery of the East Sussex health and care system work programme to improve health outcomes related to frailty and ageing, as described in the Sussex health and care partnership strategy,
- Ensure continued support for the VCSE sector, particularly those organisations which provide support for older people.
Key local plans and strategies
The East Sussex Health and Wellbeing Board’s refreshed strategy
Healthy Lives, Healthy People is a rolling 5-year strategy from 2022 to 2027, setting out a shared vision and commitment to improve health and wellbeing and reduce inequality. This requires an integrated approach with prevention and early intervention at its heart. The strategy highlights plans for integrated health and care services across the county, and shared work to improve the other factors that influence health such as access to good jobs, transport, housing and green space, and opportunities for lifelong learning, exercise, good nutrition and supportive networks and relationships between people and within communities. A key objective is working to reduce the gap in healthy life expectancy by:
- Addressing the causes of ill health to prevent premature death and the overall prevalence of disease, with specific action on:
- early cancer diagnosis
- chronic respiratory disease
- hypertension case finding to minimise risks of heart attacks and strokes
- continuity of maternity care
- annual health checks for people living with serious mental illness and learning disabilities.
- Supporting individuals and populations to adopt healthy behaviours, including promoting and supporting healthy weight, and reducing harm from alcohol and tobacco.
- Addressing the social and emotional factors that influence health in our communities, including the economic wellbeing of our population.
- Further developing capability as a system, including through locality and neighbourhood working and a ‘Population Health Management’ approach. Data and insight will help frontline teams understand current health and care needs and what factors are driving poor outcomes in different population groups – informing more proactive models of care.
Shared delivery plan – Sussex wide
Improving Lives Together Ambition to reality is the Sussex Health and Care shared delivery plan which brings together into one place the strategic, operational and partnership work that will take place across the system to improve health and care over both the short and long term. The shared delivery plan outlines long term and immediate improvement priorities, continuous improvement areas (including health inequalities) and place-based partnerships across Sussex. The plan has four key aims:
- To improve health and health outcomes for local people and communities, especially those who are most disadvantaged.
- To tackle health inequalities.
- To work better and smarter to get the most value out of funding.
- To do more to support local communities to develop socially and economically
This will be achieved through a new joined-up communities approach via Integrated Community Teams; growing and developing the workforce; and improving use of digital technology and information. Central to all of this is integration across primary care, community, mental health, local authority partners, voluntary, community and social enterprise organisations and other local partners. Integrated Community Teams are made up of professionals working together across different organisations with local communities, individuals, and their carers. Integrated Community Teams will have specific focus on addressing health inequalities, taking preventative and proactive action, and working with local partners that support the wider determinants of health, including housing.
The plan outlines place-based priorities for East Sussex, including actions specifically to improve life expectancy and healthy life expectancy and to reduce the life expectancy and healthy life expectancy gaps. For example, by supporting population health improvement, improving integrated care in four target conditions (cardiovascular disease (CVD) respiratory disease, mental health, and frailty/ageing), supporting people to stay healthy for longer, and providing more proactive preventative care for those who need it across the full range of organisations that can support this. This involves working together in local communities across Primary Care, community healthcare, education, social care, mental health, and the full range of local voluntary and community and housing organisations.
Footnotes
[1] Deprivation areas are split into quintiles, each being 20% of the population. Quintile 1 contains the 20% most deprived areas, through to quintile 5 which contains the 20% least deprived areas.
[2] An odds ratio (OR) is a measure of association between an exposure (e.g. condition) and an outcome (e.g. self-reported poor health). The OR represents the odds that an outcome will occur given a particular exposure, compared to the odds of the outcome occurring in the absence of that exposure. Greater than 1.0 indicates that the odds of SRPH with the condition is greater than the odds of SRPH without the condition. Less than 1.0 indicates that the odds of SRPH is lower than the odds of SRPH without the condition.
[3] ONS definitions of towns and coastal towns can be found in: Understanding towns in England and Wales – Office for National Statistics (ons.gov.uk) and Coastal towns in England and Wales – Office for National Statistics (ons.gov.uk)
[4] The goals of disease prevention are to avoid of the development of risk factors, which have not yet occurred (primordial prevention), and to reduce the risk factors, occurrence and spread of disease (primary prevention).
Endnotes
[1] OHID (2023) Understanding the drivers of healthy life expectancy Understanding the drivers of healthy life expectancy – GOV.UK (www.gov.uk)
[2] ONS (2018) Health state life expectancies. Quality and Methodology Information for health state life expectancies, UK health state life expectancies ukqmi | ons.gov.uk
[3] Thompson WW, Zack MM, Krahn GL, et al. Health-related quality of life among older adults with and without functional limitations.Am J Public Health.2012;102:496–502.
[4] Forman-Hoffman VL, Ault KL, Anderson WL, et al. Disability status, mortality, and leading causes of death in the United States community population.Med Care.2015;53:346–354.
[5] Katz S, Branch LG, Branson MH, et al. Active life expectancy Engl J Med.1983;309:1218–1224.
[6]UKHSA (2019) Health Matters: Prevention – a life course approach Health Matters: Prevention – A Life Course Approach – UK Health Security Agency (blog.gov.uk)
[7]ONS. Health state life expectancies by national deprivation deciles, England: 2018 to 2020. 2022
[8]Marmot et al (2011) Fair Society, Healthy Lives – the Marmot Review: Strategic Review of Health Inequalities in England post-2010 Fair Society Healthy Lives full report (parliament.uk) pdf
[9] IHME-CHAIN Collaborators (2024) Effects of education on adult mortality: a global systematic review and meta-analysis, The Lancet, Public Health
[10]How to talk about the building blocks of health – The Health Foundation