
Page Contents
Introduction
This profile should be used to inform decisions and plans and to identify priorities to improve local people’s health and wellbeing and reduce health inequalities in Hastings.
The profile identifies needs (which may also be referred to or seen as deficits) as well as assets (which may also be referred to or seen as strengths) from key indicators that have been bench marked against the England average.
Causes of premature mortality and inequalities in life expectancy are also presented.
This profile forms part of the East Sussex Joint Strategic Needs Assessment (JSNA) and draws together data and analysis from East Sussex public health reports and various health profiles produced by the Office for Health Improvment and Disparities. It brings together existing data and analysis, from a variety of sources, at Primary Care Networks (PCNs), district/borough councils and East Sussex levels.
Understanding the data
The geographies
This profile contains data for Hastings borough. Most charts, tables and maps present data at both upper tier and lower tier authorities. However, some datasets are only available at other geographies (for example some of the primary care datasets are only available by NHS geographies) and so this information will be presented at that level.
Significance testing
Where possible, data has been benchmarked and compared against England, or in some cases specific targets. Where differences are observed and found to be significant, then this will refer to statistical significance at the 95% confidence level. However, it is important to bear in mind that:
- where values are based on high counts, even small, possibly unimportant, differences may be statistically significant, and
- where values are based on low counts, even large, possibly important differences may not be statistically significant.
Rates
Where rates are used, some rates may not be age standardised. If crude rates are reported and the condition mainly affects older people, it is important to also take into account the age profile of the population. Where age standardised rates are presented, then this will be noted in the title of the chart/table.
The borough
The geography of Hastings
Hastings is located on the south east coast of England and is in the county of East Sussex. It is a one of five lower tier local authorities (Eastbourne Borough Council, Hastings Borough Council, Lewes District Council, Rother District Council and Wealden District Council). East Sussex County Council is the upper tier local authority. Hastings has a population of approximately 90,600 residents (ONS mid-year estimates, 2022).
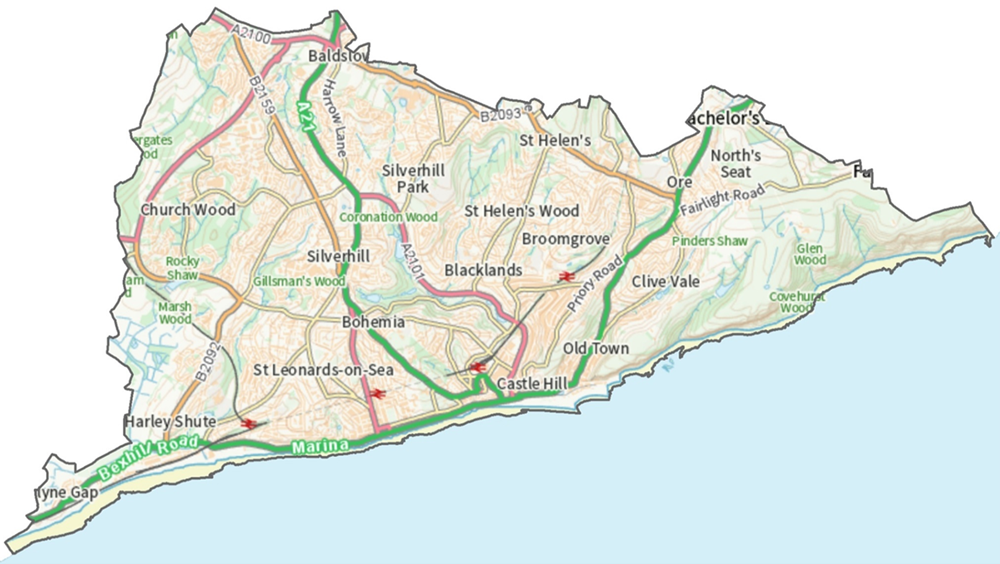
Hastings borough is situated on the coast with its land border surrounded by Rother district. The area contains the towns of Hastings and St Leonards-on-sea with the A259 running east and west along the coast and the A21 going north through the centre of the borough.
The most populated areas of the borough are in the central areas of Hastings & St Leonards, the areas to the east through Broomgrove and Ore and also north of St Leonards in Silverhill and Hollington.
Map 1 shows the borough of Hastings and details the key areas of the town and major roads.
Map 1 Hastings showing the key areas of the town and major roads
Rural & urban
Within Hastings there are 53 Lower Super Output Areas (LSOAs).
Lower Super Output Areas (LSOAs) are small areas designed to be of a similar population size, with an average of approximately 1,600 residents or 690 households in each LSOA. They were produced by the Office for National Statistics (ONS) for the reporting of small area statistics.
The ONS have classified all LSOAs as either Urban, Rural or Fringe (yet to be updated for 2021 Census data). All Hasting’s LSOAs are classified as Urban city and town. Map 2 shows the distribution of the rural and urban areas across the whole county, including Hastings.
Map 2 Urban and rural classification of each LSOA in East Sussex, 2011
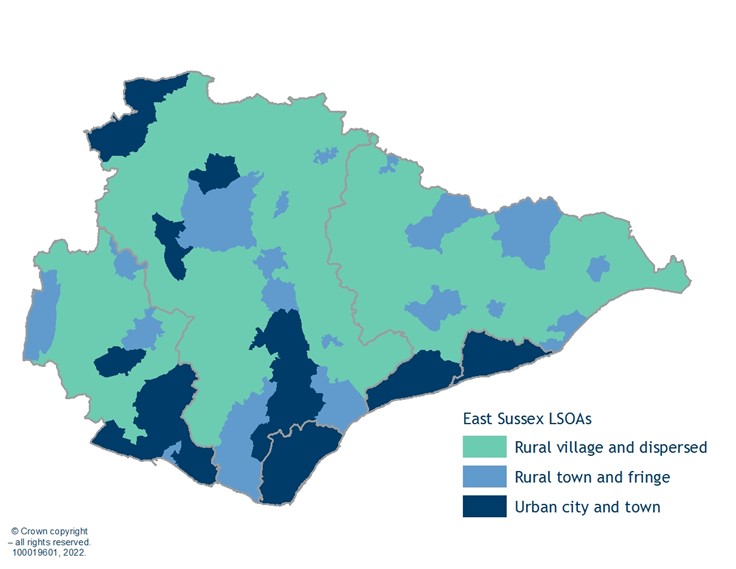
- Chart 1 shows that all of the LSOAs in Eastbourne and Hasting are urban. The other districts within the county have a mixture of rural and urban towns and villages, with Rother having over 50% of its towns and villages classified as rural or fringe.
Chart 1 The population who live in urban or rural areas for each district/borough in East Sussex, 2011
Health and care sites
Within Hastings the health and care infrastructure across the borough includes:
- 1 acute hospital (Conquest hospital)
- 9 GP practices, 3 Branch practices
- 20 community pharmacies
- 60 care homes (April 2024)
- 1 independent school, 25 maintained schools (School Census, January 2024)
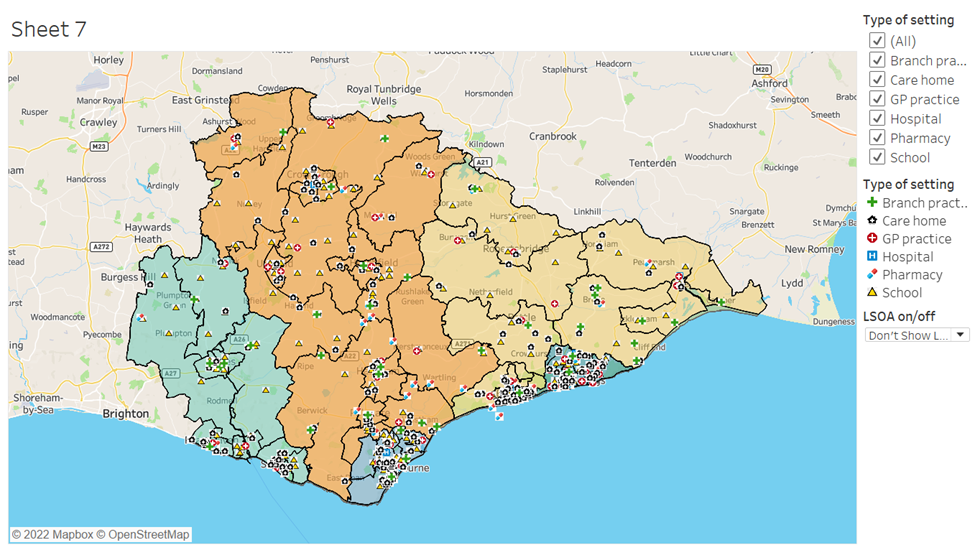
We have developed an online mapping tool using Tableau which will allow you to select different geographies and health and care settings to create bespoke maps. To access this mapping tool go to the East Sussex Health and Care Tableau Mapping Tool to look at these maps in more detail.
Tableau is a data visualisation tool. For more information about Tableau visit Visualise public data | Explore, learn, share | Tableau Public.
Map 3 An example of the East Sussex Health and Care Tableau Mapping Tool highlighting where the hospitals and pharmacies are across the county
Map 4 Primary care networks in East Sussex, 2023
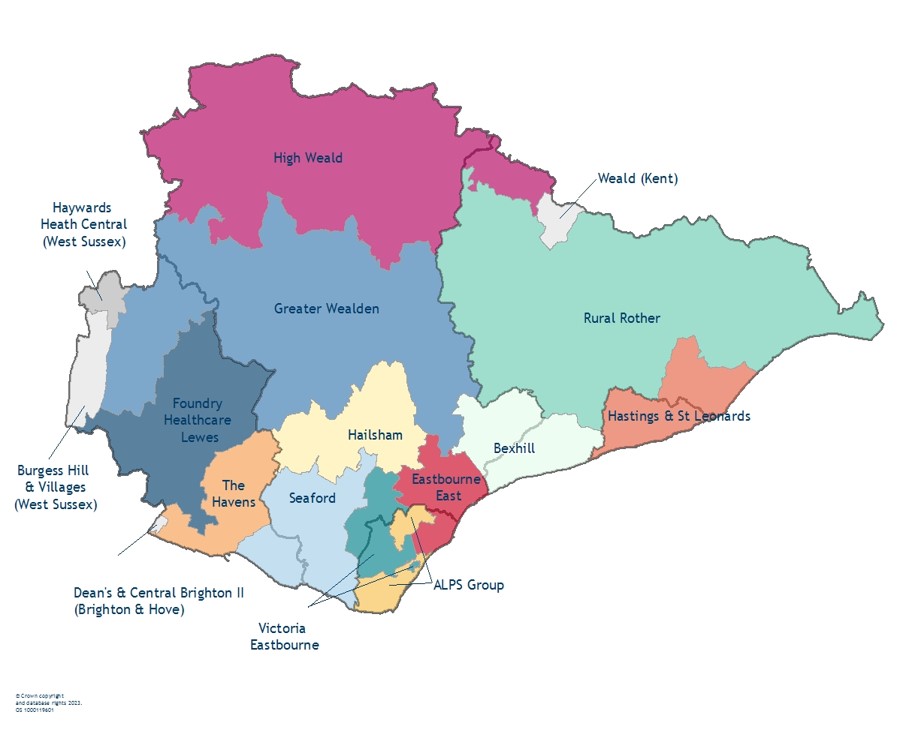
There are 12 Primary Care Networks (PCNs) in East Sussex covering a registered population size of 566,900 (April, 2023). PCNs are groups of GP practices which work together with community, mental health, social care, pharmacy, hospital and voluntary services in their local area. In each PCN there are usually approximately 30,000 to 50,000 patients.
There are no strict geographical boundaries for PCNs as their reach and coverage is based on where each GP’s registered population live. Some patients who live geographically next door to one another may be registered with different GP practices, which in turn may be part of different PCNs, and so there is no obvious geographical border.
However, to show a PCN on a map we have carried out a mapping exercise to try to highlight the geographical areas which contain the majority of patients for each PCN. Map 4 shows the areas where the majority of each PCN’s registered patients live. The different colours on the map represent the different PCN areas. Note that certain PCNs (e.g. ALPS Group) are represented by 2 separate areas on the map. Some areas in East Sussex (mainly on the boarders of the county) show PCNs from outside of East Sussex. This is because the majority of East Sussex residents in those areas are registered with non-East Sussex GP practices, and so belong to non-East Sussex PCNs.
Hastings & St Leonards is the only PCN with a footprint within Hastings. Hastings & St Leonards footprint also extends into Rother district. The PCN is the largest in East Sussex with approximately 101,000 registered patients.
In this area profile, there are tables which show data for all the PCNs within East Sussex (Table 8, Table 16). However, for this Hastings borough area profile, any commentary about PCN data will refer to Hastings & St Leonards PCN.
Population demographics
Deprivation
- The most deprived areas in Hastings are mainly in Hollington, the town centre and along the seafront (including St Leonards) and around Tressell/Broomgrove, and north west of Ore.
- Table 1 shows the most deprived quintile has the highest percentage of people aged under 65, and the lowest percentage aged over 65, compared to the other quintiles.
- Hastings has no LSOAs in the least deprived quintile.
Map 5 Areas of deprivation in Hastings showing the LSOAs ranking according to their deprivation quintile, 2019
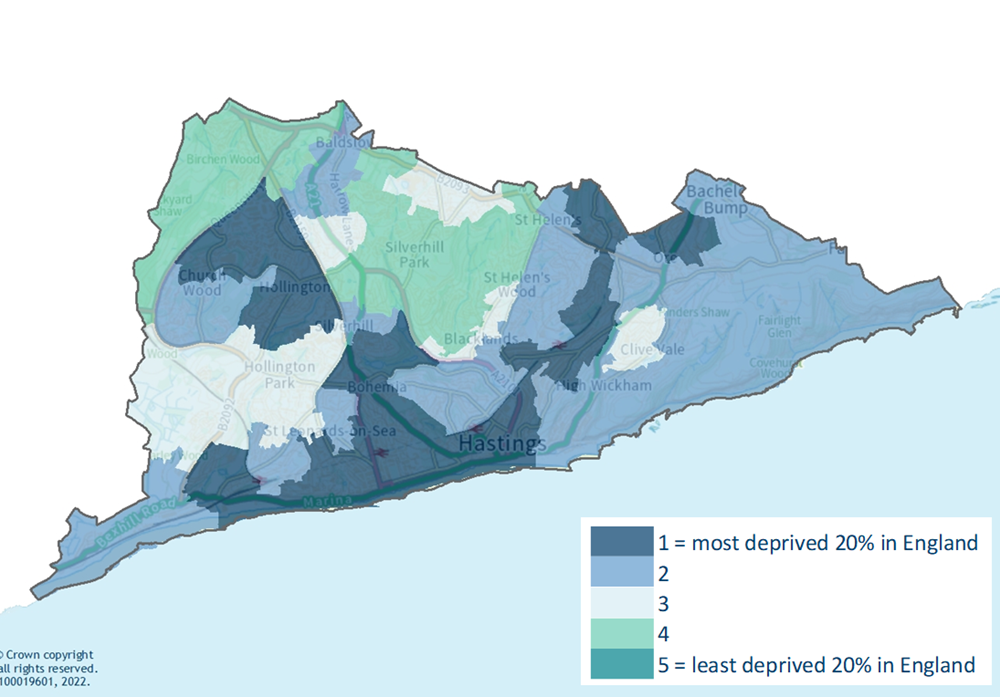
Table 1 Hastings age profile for deprivation quintiles, 2020
| National IMD Quintile | 0-4 | 5-19 | 20-64 | 65+ |
|---|---|---|---|---|
| 1 = most deprived 20% areas in England | 6% | 18% | 59% | 17% |
| 2 | 5% | 17% | 56% | 21% |
| 3 | 5% | 16% | 52% | 28% |
| 4 | 5% | 16% | 54% | 26% |
| 5 = least deprived 20% areas in England | 0% | 0% | 0% | 0% |
Age structure
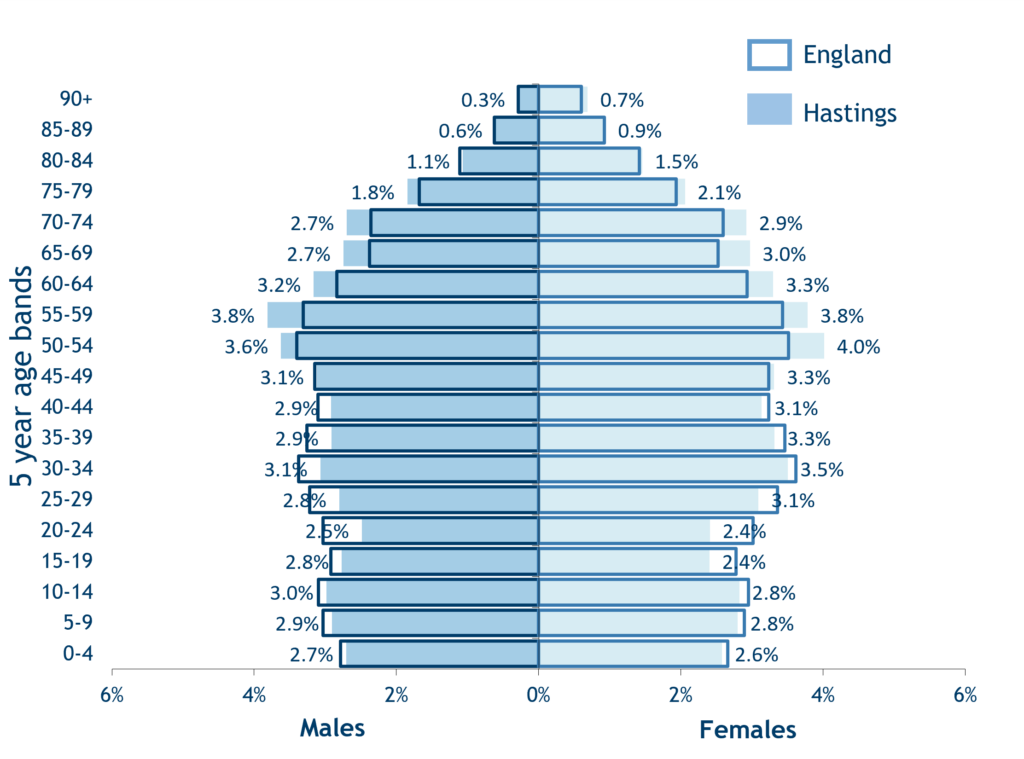
- Hastings has a similar age structure compared to England. However, it has a slightly higher percentage of 50 to 74 years olds (both males and females) compared to England.
- Hastings also has a slightly lower percentage for younger age ranges especially those aged 20 to 44 year olds (both males and females) than England.
Chart 2 Hastings population profile (total population 90,984), 2021
Population for different age groups
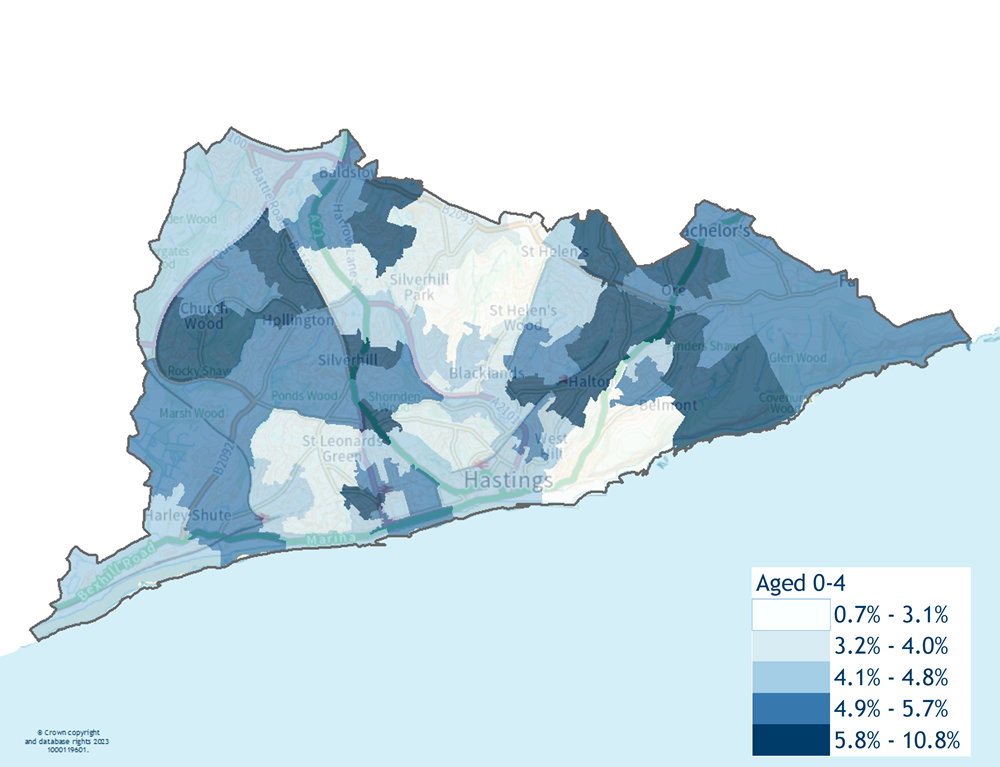
- Map 6 shows the highest percentage of children aged 0-4 are mainly in the Ore, Tressell Baird (Eastern side of Hastings), Hollington, Wishing Tree and parts of West St Leonards, Conquest and Silverhill.
Map 6 The percentage of children aged 0 to 4 in Hastings LSOAs, 2021
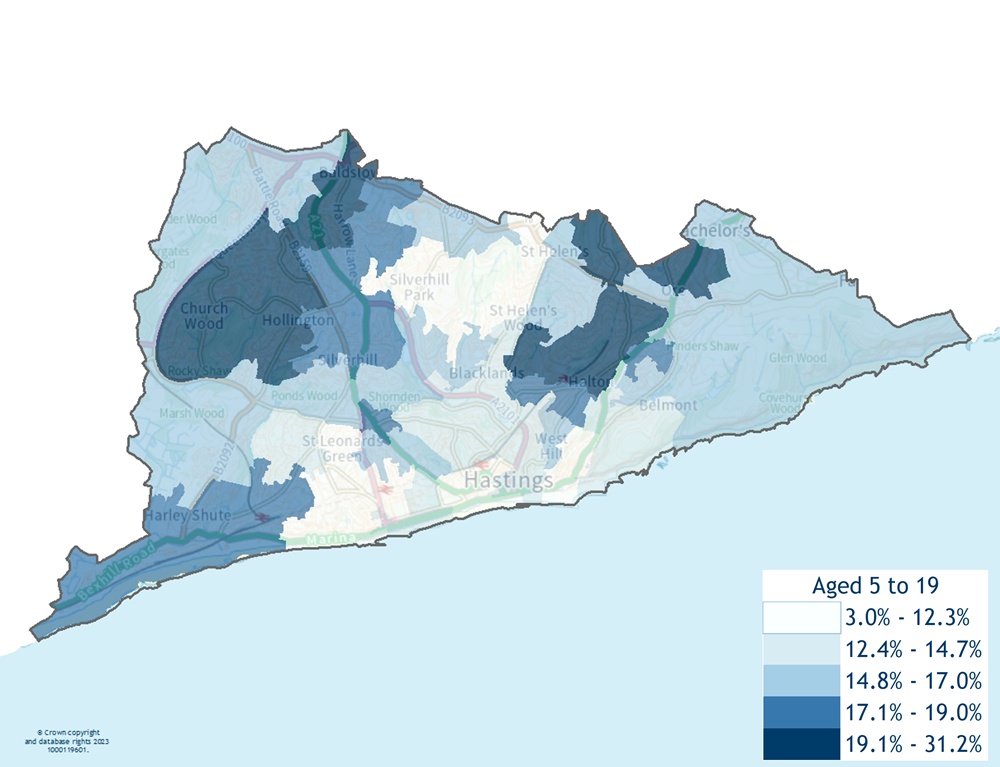
- Hollington, eastern parts of Ashdown, Tressell/Broomgrove, and north west of Ore (Map 7).
Map 7 The percentage of people aged 5 to 19 in Hastings LSOAs, 2021
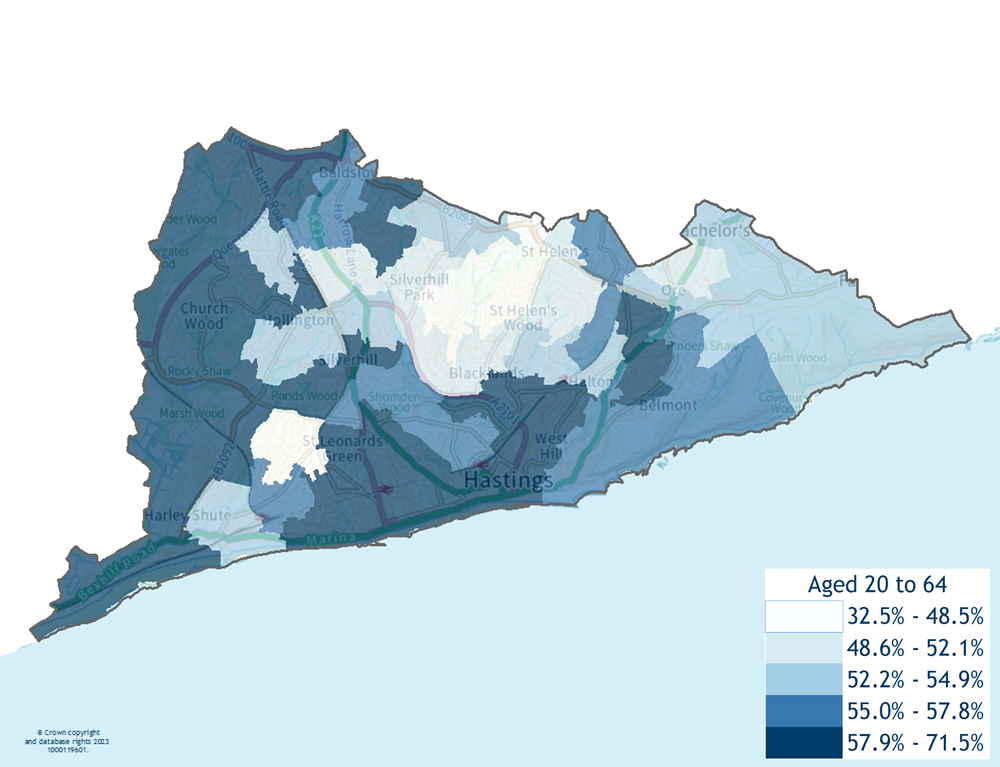
- West St Leonards, Hollington, Ashdown, Gensing, Central St Leonards, Castle, north Tressell, north Old Hastings, parts of Baybrooke and Conquest have some of the highest percentages of working age people (Map 8).
Map 8 The percentage of people aged 20 to 64 in Hastings LSOAs, 2021
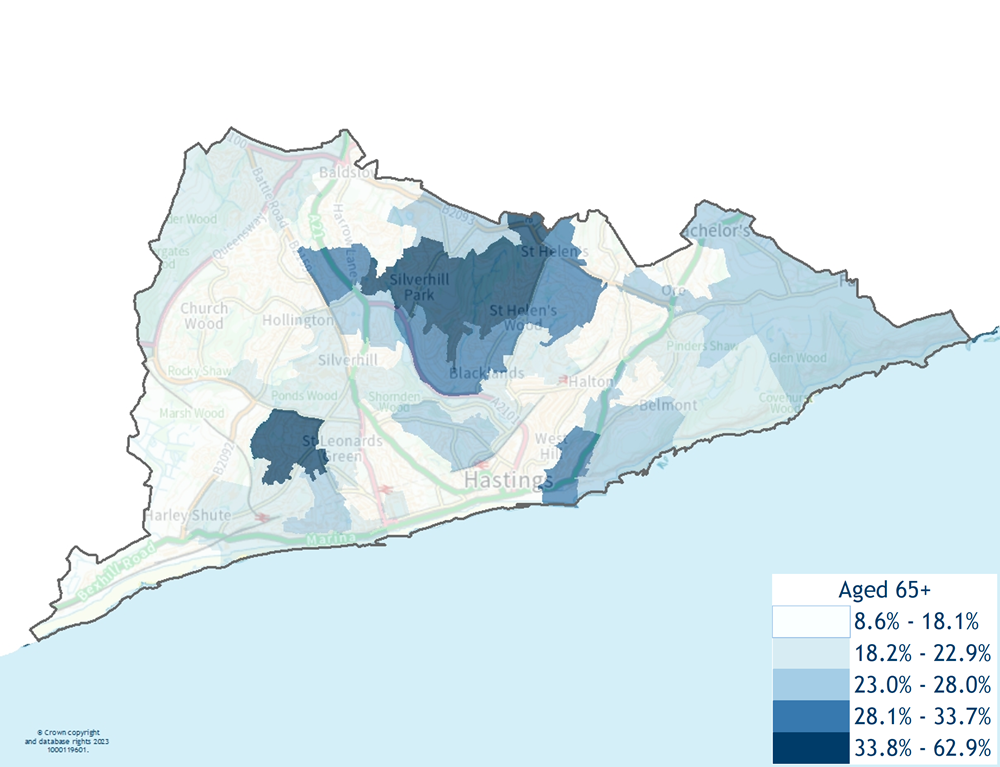
- The highest percentages of people aged 65+ live in Silverhill Park and St Helens and Maze hill.
Map 9 The percentage of people aged 65+ in Hastings LSOAs, 2021
Ethnicity
- Data from the 2021 census shows that Hastings has a higher percentage (approximately, 85%) of White British and Northern Irish compared to England (approximately, 74%). Other white (5.3%) is by far the largest Ethnic group other than White British or Northern Irish, in Hastings.
- Chart 3 shows a comparison of all other ethnicities in Hastings compared to England and East Sussex.
Chart 3 Ethnic groups other than White British or Northern Irish, 2021
Chart 4 Ethnicity and broad age group in Hastings , 2021
Birth rate
- There has been a general decline in the live birth rate in East Sussex over the past 5 years (Chart 5), similar to what has been observed in England.
- Hastings consistently has a higher birth rate (all ages) then England and East Sussex.
Chart 5 Live birth rate (per 1,000 women aged 15 to 44 years) between 2014 and 2020
Table 2 shows for Hastings that for women in age groups under 30, birth rates were higher than England and East Sussex while those aged 30-34 and 35-39 birth rates are lower than England and East Sussex.
The rates for women under 20 years, and 40 years and over, are based on the female population aged 15 to 19 years and 40 to 44 years, respectively. That rates for women of all ages are based on the female population aged 15 to 44 years.
Table 2 Live Birth rate (per 1,000 women in the age group), 2020
| Location | Under 20 | 20-24 | 25-29 | 30-34 | 35-39 | 40 & Over | all ages |
|---|---|---|---|---|---|---|---|
| England | 10 | 45 | 85 | 103 | 60 | 16 | 55 |
| East Sussex | 10 | 50 | 92 | 104 | 56 | 13 | 53 |
| Eastbourne | 15 | 54 | 101 | 107 | 47 | 12 | 54 |
| Hastings | 17 | 68 | 94 | 99 | 50 | 15 | 59 |
| Lewes | 7 | 39 | 88 | 102 | 63 | 13 | 51 |
| Rother | 7 | 52 | 90 | 96 | 63 | 15 | 53 |
| Wealden | 6 | 39 | 90 | 110 | 57 | 13 | 51 |
Population change
- There is projected to be 1,700 more people living in Hastings in 2026 compared to 2022 which is a 2% increase.
- The highest increase projected will be for people aged 65-84 with some 1,500 (9%).
Table 3 Hastings borough population projections for 2022 and 2026
| Age | 2022 | 2026 | Change | % Change |
|---|---|---|---|---|
| 0-17 | 19,022 | 18,668 | -354 | -2% |
| 18-64 | 53,958 | 54,334 | 376 | 1% |
| 65-84 | 17,000 | 18,473 | 1,473 | 9% |
| 85+ | 2,729 | 2,887 | 158 | 6% |
| All ages | 92,709 | 94,362 | 1,653 | 2% |
Wider determinants of health
Housing
- Hastings has the lowest percentage of owner occupied housing (57%) and the highest percentage of private rented housing (29%) compared to East Sussex.
Chart 6 Dwelling stock by tenure, 2021
- Chart 7 shows that overcrowding of households in Hastings was lower for both socially rented housing (14%) and in privately rented households (13%) compared with England & Wales and East Sussex.
Chart 7 Overcrowded households in East Sussex by tenure, 2021
Income
- Hastings average (median) full time earnings are the lowest in East Sussex and below the average (median) full time in England.
Chart 8 Resident-based average (median) full time and part time earnings, 2022
Please note: the data for part-time workers for Eastbourne, Lewes, Rother, and Wealden was unavailable for 2022 so 2021 data was used.
Employment
Hastings has the lowest percentage of working age people in employment (72.9%).
Chart 9 Working age (16 to 64) people in employment, 2020
Education
- Hastings has higher proportions of lower level (none – level 2) qualifications compared to East Sussex and England.
- Hastings also has the second lowest proportion of level 4 (31%) qualified people compared with other districts or boroughs in East Sussex and England.
Chart 10 Qualifications of working age population, 2021
Source: ONS Nomis Annual Population Survey: Qualifications of working age population, 2020. Note the data for no qualifications for Lewes district was unavailable for 2020 so 2019 data were used.
The data shown in Chart 10 shows the percentage of people who have “up to” a specific qualification level. For example, 10% of people in England are qualified up to level 1 only, 17% are qualified up to level 2 only, 19 % are qualified up to level 3 only, etc.
The different levels of qualifications are defined as:
- Level 1: 1+ O level passes, 1+ CSE/GCSE any grades, NVQ level 1, Foundation GNVQ.
- Level 2: 5+ O level passes, 5+ CSEs (grade 1’s), 5+ GCSEs (grades A-C), School Certificate, 1+ A levels/AS levels, NVQ level 2, Intermediate GNVQ.
- Level 3: 2+ A levels, 4+ AS levels, Higher School Certificate, NVQ level 3, Advanced GNVQ, ONC, OND, BTEC National etc.
- Level 4 and above: First degree, Higher degree, NVQ levels 4 and 5, HNC, HND, Professional qualifications (for example teaching, nursing, accountancy).
- Other qualifications: Vocational/Work-related Qualifications, Foreign Qualifications, includes any qualifications not mentioned above.
Crime
- Hastings has higher rates of total crime (excluding fraud) and violence against the person compared to East Sussex and England.
Chart 11 Total recorded crime and violence against the person, 2022
Loneliness & isolation
- Those who answered the survey question saying they ‘often or some of the time felt lonely living in your local area’ were slightly higher in Hastings compared to East Sussex.
- The response to this question across all areas when looking at how people answered the survey in previous years is broadly the same with no discernible trend.
Chart 12 Community Survey – Responses to the question “do you ever feel lonely living in your local area?”, 2015 to 2019
Environment
- Domestic carbon dioxide (CO2) emissions were the largest of the three sectors in 2005 but these emissions have fallen by 41% in 2020.
- The industrial and commercial sector emissions have continued to fall with a 58% decrease in 2020 compared to 2005.
- The transport sector of CO2 emissions has had a reduction over the period with a decline of 29% which is the least compared to the other sectors.
Chart 13 CO2 Emissions by sector 2005 to 2020 in East Sussex
- The reduction of CO2 has been consistent across all districts and boroughs through the years 2005-2020 with a 50% reduction for East Sussex.
- In 2005 Hastings had 5.0 per capita emissions but by 2020 it has reduced to 2.4 per capita emissions a (52%) reduction.
Chart 14 Emissions of carbon dioxide per person in East Sussex by district and borough, 2005 to 2020
Access to healthy spaces
Natural England have produced an online map that shows where all the green spaces are within the UK. To access the tool go to Natural England’s Green Infrastructure Map. The mapping tool provides many different layers that can be selected in order to provide a map view of resources of the local area.
Map 10 shows the green and blue spaces in East Sussex, produced using the mapping tool.
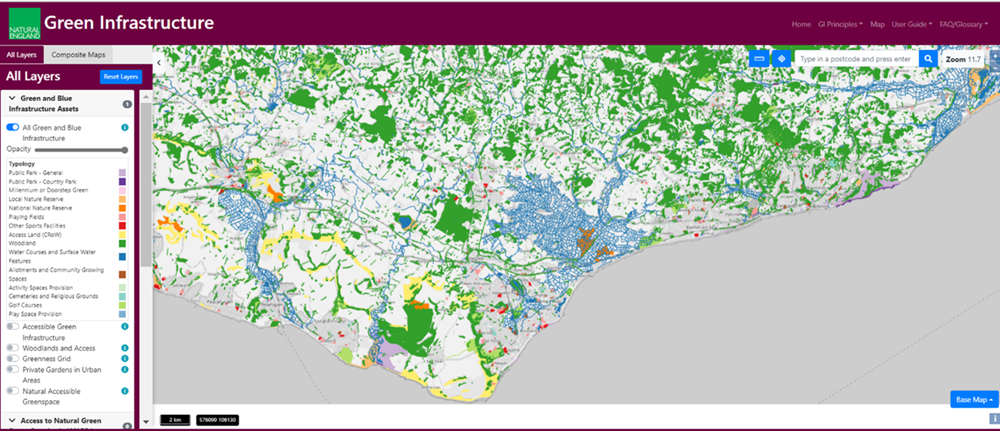
Blue spaces are outdoor environments, either natural or built, that prominently feature water such as streams, ponds, canals and other water bodies.
Life expectancy
Life expectancy
- Life Expectancy (LE) at birth is higher at an East Sussex level compared to England and higher for females than males. LE was increasing in East Sussex up to around 2012-2014 when it began to plateau. The latest data (2018-2020) estimates that life expectancy for females in East Sussex is 84.1 years and for males 80.1 years.
- At a lower tier level, for males and females, Hastings has the lowest LE compared to the other district and boroughs. The LE in Hastings for males has increased over the period from 75.2 years (2001-2003) to 78.0 years (2018-2020). For females LE has increased over the period from 79.6 years (2001-2003) to 81.8 years (2018-2020).
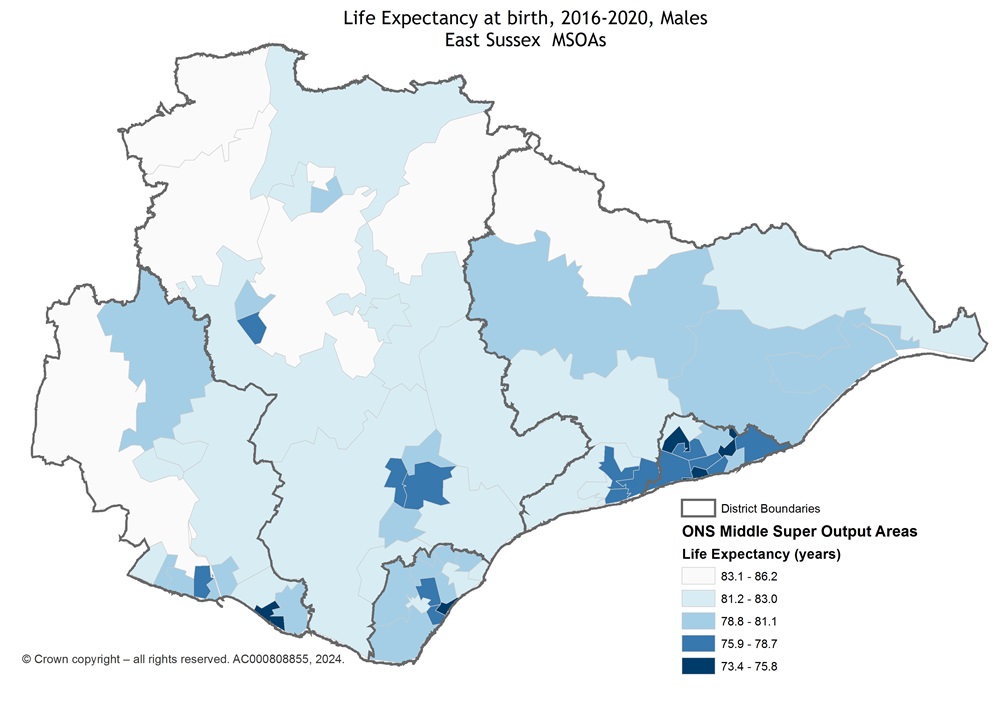
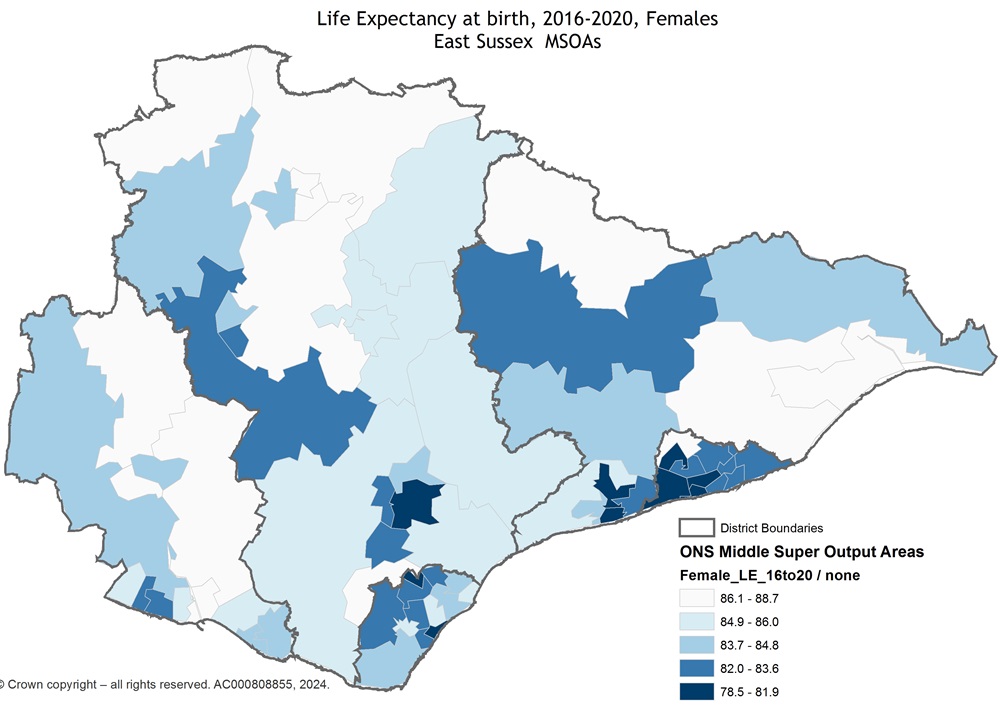
- At a small area level (MSOA, latest data 2016-2020) in Hastings for males it is lowest in Central St Leonards (74.8 years). The highest is found in Ashdown (81.5 years). For females in Hastings the lowest is in Central St Leonards (78.5 years). The highest is found in Ashdown (87.3 years).
Table 4 Life expectancy for males and females in East Sussex districts and boroughs, 2018-2020
| Location | Males | Females |
|---|---|---|
| Eastbourne | 78.9 | 83.6 |
| Hastings | 78.0 | 81.8 |
| Lewes | 80.5 | 84.8 |
| Rother | 80.4 | 84.3 |
| Wealden | 81.6 | 85.0 |
Chart 15 Life expectancy between 2001 to 2003 and 2018 to 2020, East Sussex and England
Chart 16 Life expectancy for males: between 2001 to 2003 and 2018 to 2020 by district and borough
Chart 17 Life expectancy for females: between 2001 to 2003 and 2018 to 2020 by district and borough
Middle Layer Super Output Areas (MSOAs) are a geographic hierarchy designed to improve the reporting of small area statistics in England and Wales. MSOAs are built from groups of LSOAs. In East Sussex there are 69 MSOAs, each containing on average 8,200 residents.
Map 11 Life expectancy for males, MSOAs 2016-2020
Map 12 Life expectancy for females, MSOAs 2016-2020
Gap in life expectancy
- Circulatory conditions contribute the most to the gap in LE between the most and least deprived areas in Hastings for both males and females (21.2% and 32.5%).
- For males, digestive conditions with (21.2%) is the equal highest with circulatory conditions contributes to the LE gap. External causes and respiratory conditions are the next highest contributors to the LE gap.
- For females, respiratory conditions are the second highest closely followed by other and mental and behavioural.
Chart 18 Breakdown of the LE gap (within area) between most and least deprived areas in Eastbourne, 2017 to 2019
Healthy life expectancy
- In the latest time period (2018-2020) healthy life expectancy for males (63.1 years) is the same as for England. However, for females in East Sussex (63.3) it is lower than nationally (63.9) but has increased from a drop in 2017-19 which was the lowest it had been in the last 10 years.
Chart 19 Healthy Life Expectancy at birth, East Sussex and England, between 2009 to 2011 and 2018 to 2020
Please note ‘years’ axis does not start at zero
Leading causes of death
- Across all ages dementia is the leading cause of death in Hastings followed by heart failure.
- From a premature mortality perspective (deaths in under 75s), the leading cause of death is ischaemic heart disease, followed by chronic lower respiratory diseases.
Table 5 All ages, leading cause of death (numbers of deaths shown, with cancers broken down), 2022
Table 6 Under 75s, leading cause of death (numbers of deaths shown, with cancers broken down), 2022
Premature mortality (deaths under 75s)
- Premature mortality is highest in Hastings and Lowest in Wealden. All areas had a decrease in premature mortality in 2022 compared to the previous year.
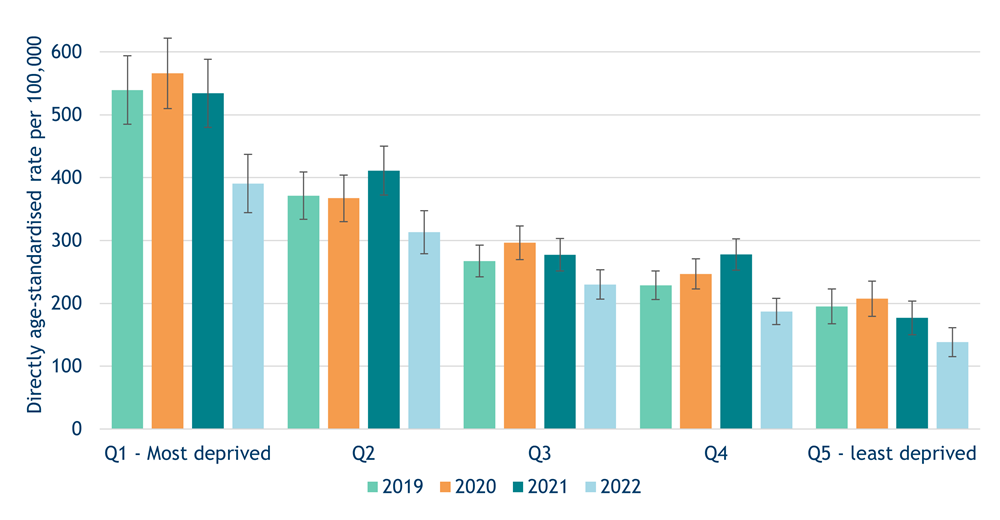
- Premature mortality is highest in the most deprived quintile.
- All quintiles saw a reduction in premature mortality in 2022 compared to the previous year. For quintiles 1, 2 and 4 this decrease was significantly different from the previous year.
Chart 20 Premature mortality (under 75s) from all causes, by district and borough, 2019 to 2022
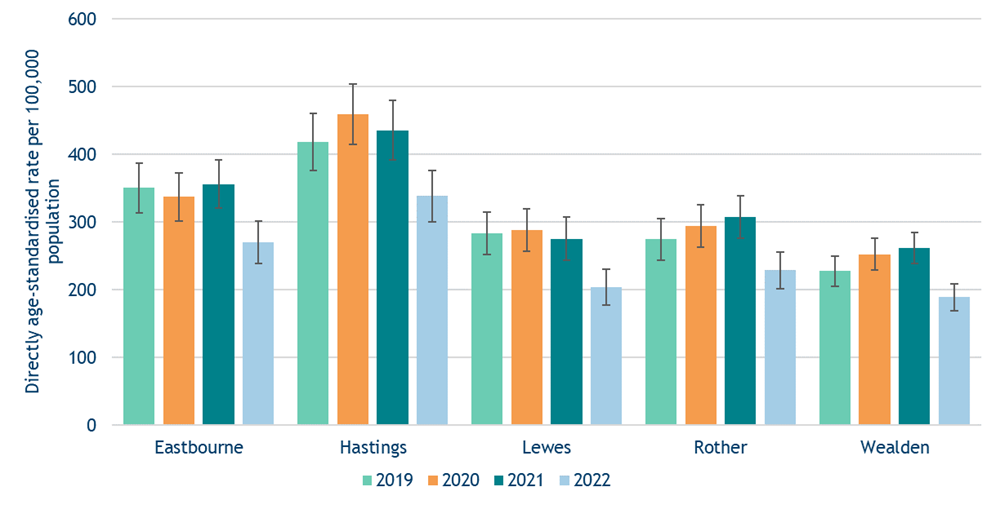
Chart 21 Premature mortality (under 75s) from all causes, rates by national deprivation quintile, 2019 to 2022
Disease & poor health
Disability
- In the 2021 Census Hastings had 20,525 people living with a Limited long-term illness. This is projected to increase to 25,048 an increase of 22% by 2035.
- The projected overall disability in 2020 was 18,697. This is projected to increase to 22,426 and increase of 20%.
- The highest number of Disability Living Allowance (DLA) and Personal Independence Payments (PIP) is in Hastings.
Please note: Disability living allowance (DLA) & Personal Independence Payments (PIP) – all claimants, May 2021.
Table 7 Data on disability for 2020 and the projected numbers for 2035
| Illness / Disability | East Sussex | Eastbourne | Hastings | Lewes | Rother | Wealden |
|---|---|---|---|---|---|---|
| Limited Long-Term illness – 2021 | 110,553 | 21,919 | 20,525 | 20,342 | 20,138 | 27,629 |
| Projected LLTI – 2020 | 118,510 | 22,906 | 21,434 | 21,084 | 22,481 | 30,604 |
| Projected LLTI – 2035 | 147,795 | 27,019 | 25,048 | 26,073 | 28,057 | 41,598 |
| Projected overall disability – 2020 | 96,597 | 18,697 | 17,398 | 17,184 | 18,436 | 24,881 |
| Projected overall disability – 2035 | 122,427 | 22,462 | 20,698 | 21,578 | 23,360 | 34,330 |
| Disability Living Allowance (DLA) and Personal Independence Payments (PIP) (All claimants, August 2022) | 35,227 | 7,682 | 8,213 | 6,122 | 6,020 | 7,196 |
Source: East Sussex in Figures. Limited Long-Term illness – 2011 ; Projected LLTI ; Projected overall disability ; Disability Living Allowance (DLA) and Personal Independence Payments (PIP)
Quality & Outcomes framework
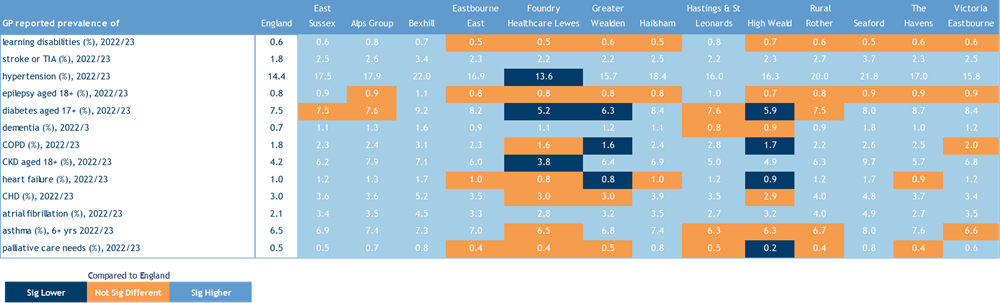
Table 8 shows extracts from the Quality and Outcomes Framework (QOF) for 2022/23.
Data within the QOF is not aged standardised and so some areas of high or low prevalence may in some part be a result of the age demographics of the area. It is important to understand more about the demography when interpreting this data. Office for Health Improvement and Disparities have produced some National General Practice area profiles for PCNs, which include a “Data View” of the population.
This data can be access via PHEs National General Practice Profiles online Fingertips tool.
- In table 8 Hastings & St Leonards the majority of conditions are significantly lower compared to England.
Table 8 GP reported disease prevalence for each Primary Care Network in East Sussex, 2022/23
View table 8 as a larger table pdf 106kb
To see what geographical footprints the Primary Care Networks cover see Map 4 in the “Primary Care Network” section of this document.
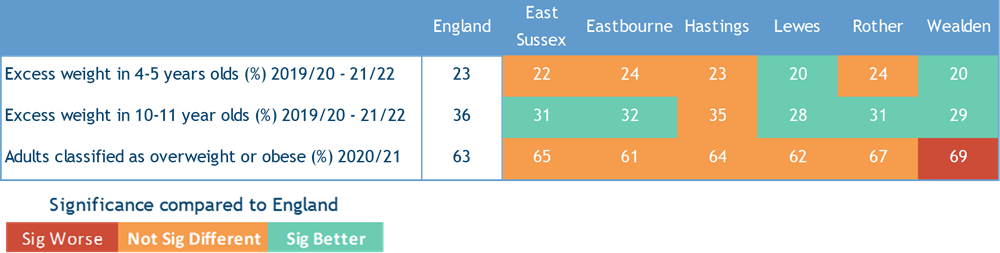
Obesity
- Hastings has a similar percentage of children with excess weight compared to England for those aged 4-5 years old and 10-11 years.
- Hastings also have similar percentages of adults classified as overweight or obese compared to England.
Table 9 Excess weight and obesity in young people and adults, between 2019 and 2022
Health related behaviours
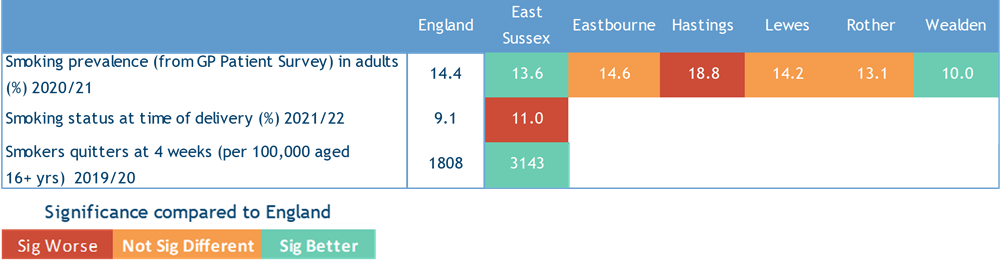
Smoking
- Hastings has significantly worse smoking prevalence compared to England.
Table 11 Smoking prevalence and quit rates, between 2019 and 2021
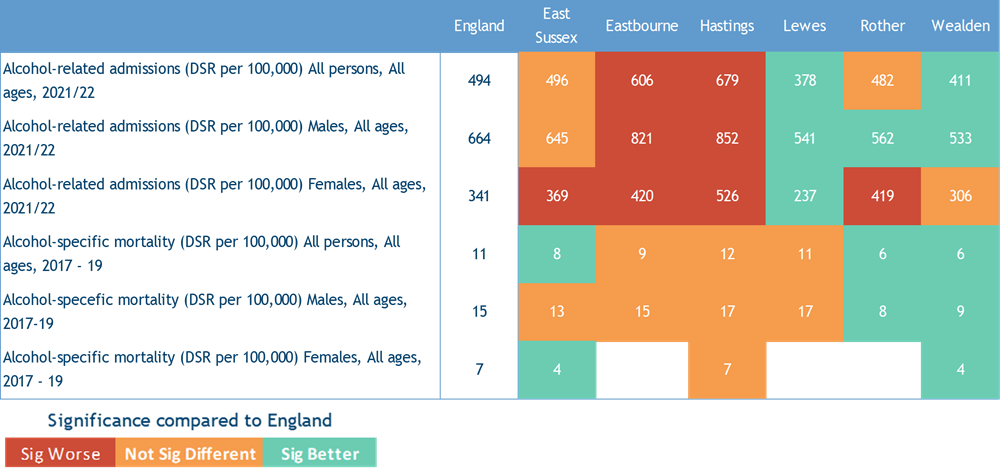
Alcohol
- Hastings has significantly worse rates of alcohol-related admissions, and also higher rates of alcohol-specific mortality (though not significantly) compared to England.
Table 12 Alcohol, between 2017 and 2022
Physical activity & healthy eating
- Hastings is significantly worse for the proportion of population meeting their recommended “5 a day”. Hastings has significantly better percentage of physically active adults compared to England. Hastings has similar levels of inactive adults and proportion of adults cycling for travel at least 3 days per week, compared to England.
Table 13 Physical activity and healthy eating, between 2019 and 2022
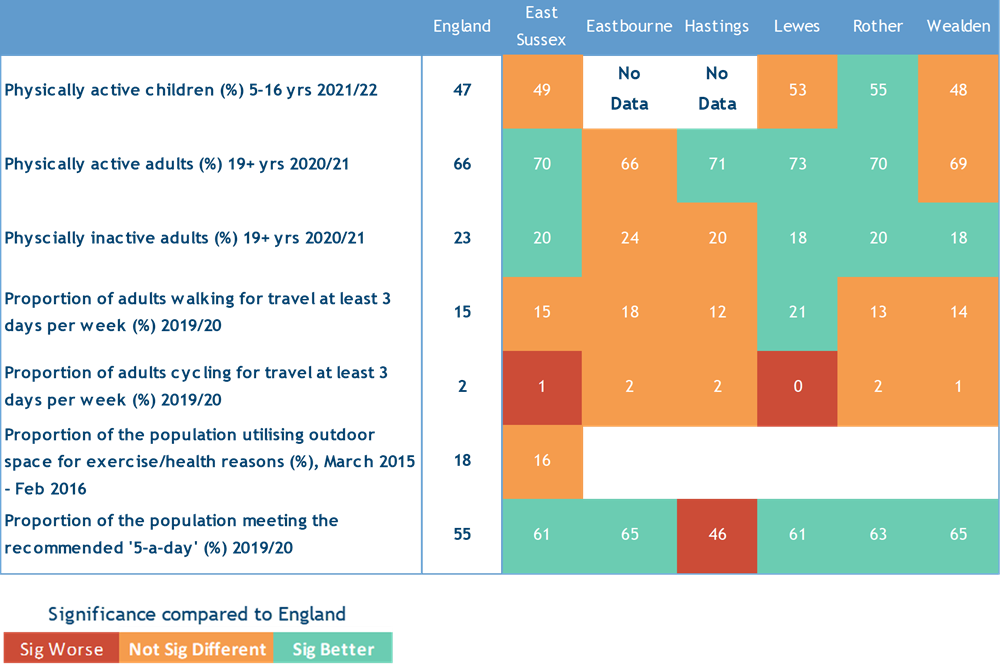
No Data: Value missing due to small sample size
Sexual health
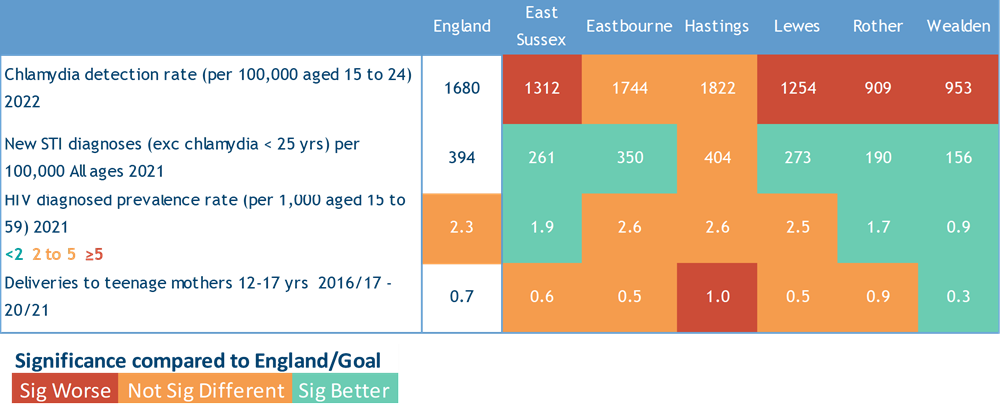
- Compared to England, new STI diagnoses (which exclude chlamydia in under 25 year olds) are similar in Hastings to that of England.
- Compared to England, the chlamydia detection rates in people aged 15 to 24 years is similar in Hastings.
- Compared to a target goal, Hastings has a similar HIV diagnosis prevalence rate per 1,000.
Table 14 Sexual health, between 2020 and 2022
Drug & Alcohol treatment
- Hastings has significantly higher rates of adults in drug and/or alcohol treatment and for young people in drug or alcohol treatment.
Table 15 Drug and alcohol treatment, between 2020 and 2022

Screening & immunisation
- Data for immunisation is only presented at East Sussex County level. For all childhood immunisations East Sussex is below the 95% goal for vaccination and significantly below the goal for DTaP and IPV booster in 5 year olds.
- A significantly higher percentage of 65+ year olds received their seasonal flu vaccination in East Sussex compared to the 75% goal for vaccination cover.
Table 16a Immunisations, between 2019 and 2022
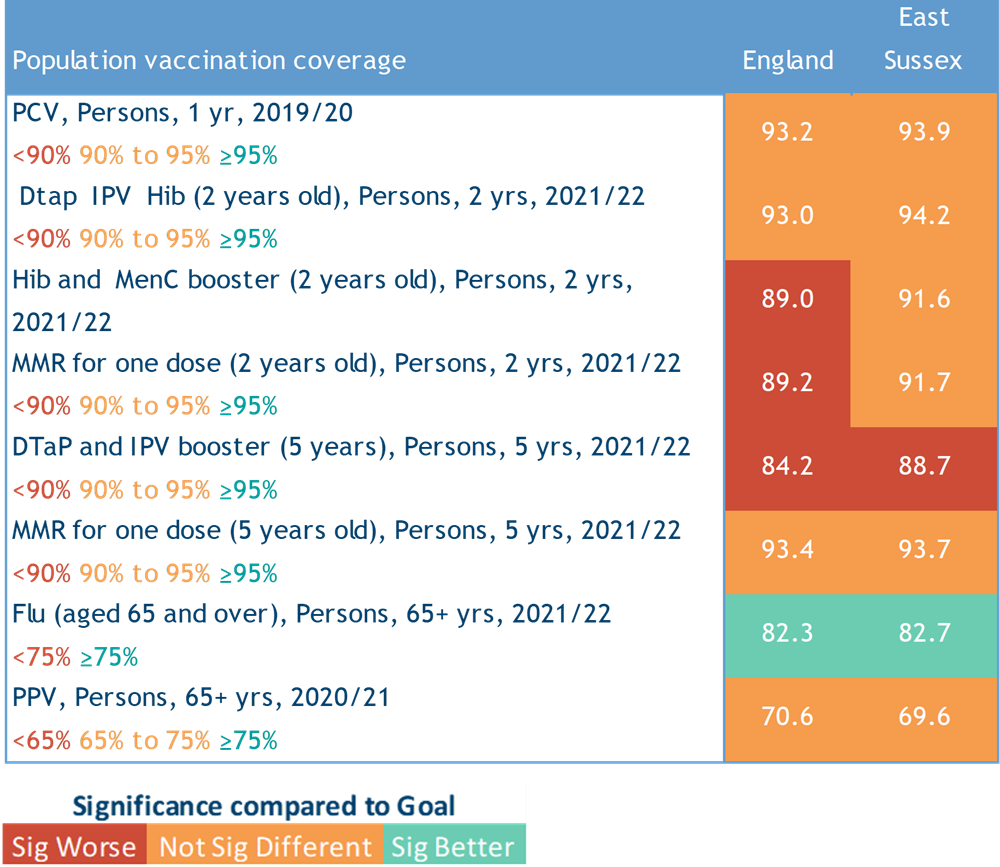
Table 16b Screening, between 2021 and 2022
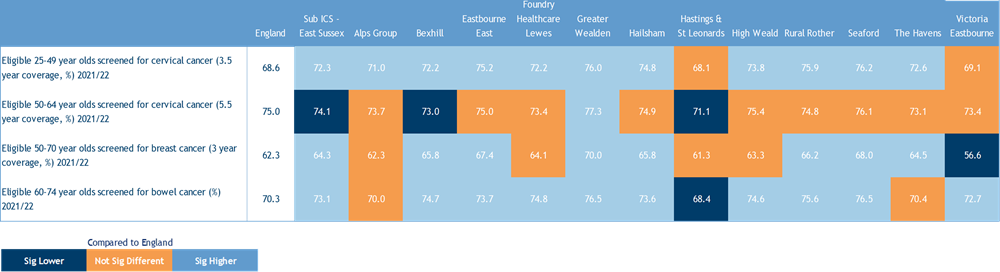
View table 16b as a larger table
- Hastings & St Leonards PCN has significantly lower eligible 50-64 years old screened for cervical cancer and 60-74 years old screened for bowel cancer compared to England.
Health & social care services
Maternity
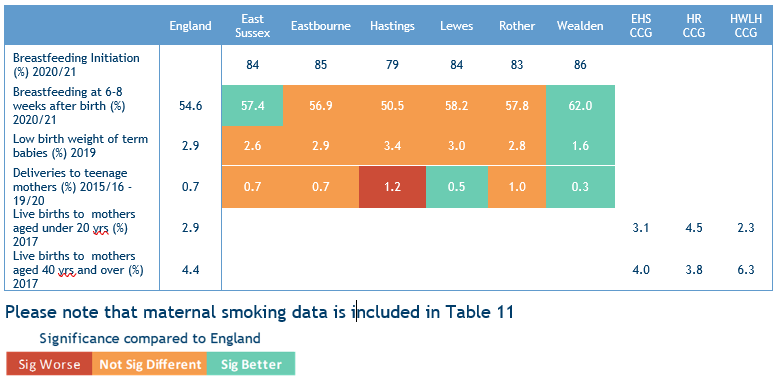
- Hastings has a similar percentage of mothers breastfeeding at 6-8 weeks, compared to England.
- Deliveries to teenage mothers are significantly worse for Hastings compared to England.
Table 17 Pregnancy and birth, between 2017 and 2021
Hospital attendance
- As the main provider of acute services in East Sussex, East Sussex Healthcare Trust (ESHT) provide at least half of all emergency and elective admissions, A&E and outpatient attendances for East Sussex residents. They are the main provider of services to residents in Hastings.
Table 18 Emergency admissions by hospital Trust admitted to, 2022/23
| NHS Trust | East Sussex | Eastbourne | Hastings | Lewes | Rother | Wealden |
|---|---|---|---|---|---|---|
| East Sussex Healthcare Trust | 70% | 93% | 94% | 26% | 87% | 52% |
| University Hospitals Sussex | 15% | 3% | 2% | 69% | 2% | 13% |
| Maidstone and Tunbridge Wells | 10% | 0% | 1% | 0% | 7% | 29% |
| Elsewhere | 4% | 4% | 3% | 4% | 4% | 6% |
| Percent Total | 100% | 100% | 100% | 100% | 100% | 100% |
Table 19 Elective admissions by hospital Trust admitted to, 2022/23
| NHS Trust | East Sussex | Eastbourne | Hastings | Lewes | Rother | Wealden |
|---|---|---|---|---|---|---|
| East Sussex Healthcare Trust | 59% | 82% | 84% | 20% | 79% | 46% |
| University Hospitals Sussex | 19% | 6% | 5% | 63% | 4% | 14% |
| Maidstone and Tunbridge Wells | 5% | 0% | 0% | 0% | 4% | 15% |
| Elsewhere | 17% | 12% | 11% | 17% | 13% | 24% |
| Percent total | 100% | 100% | 100% | 100% | 100% | 100% |
Table 20 First outpatient attendances, 2022/23
| NHS Trust | East Sussex | Eastbourne | Hastings | Lewes | Rother | Wealden |
|---|---|---|---|---|---|---|
| East Sussex Healthcare Trust | 60% | 82% | 89% | 20% | 82% | 44% |
| University Hospitals Sussex | 16% | 4% | 3% | 61% | 3% | 10% |
| Maidstone and Tunbridge Wells | 8% | 0% | 0% | 0% | 5% | 22% |
| Elsewhere | 16% | 14% | 8% | 19% | 10% | 23% |
| Percent total | 100% | 100% | 100% | 100% | 100% | 100% |
Table 21 A&E attendances, 2022/23
| NHS Trust | East Sussex | Eastbourne | Hastings | Lewes | Rother | Wealden |
|---|---|---|---|---|---|---|
| East Sussex Healthcare Trust | 61% | 94% | 96% | 14% | 87% | 40% |
| University Hospitals Sussex | 15% | 2% | 1% | 52% | 1% | 11% |
| Sussex Community Foundation Trust | 15% | 1% | 0% | 31% | 2% | 28% |
| Elsewhere | 9% | 2% | 2% | 2% | 9% | 21% |
| Percent total | 100% | 100% | 100% | 100% | 100% | 100% |
Hospital activity
- Over the last 12 years Hastings has had the lowest number of elective admissions.
- Numbers of A&E attendances (which includes attendances at Urgent Treatment Centres and Minor Injury Units) are the second lowest in Hastings.
Chart 26 Number of emergency admissions, 12-year trends, for East Sussex districts/boroughs, 2011/12 to 2022/23
Chart 27 Number of elective admissions, 12-year trend for East Sussex districts/boroughs, 2011/12 to 2022/23
Chart 28 Number of first outpatient attendances, 12-year trend for East Sussex districts/boroughs, 2011/12 to 2022/23
Chart 29 Number of A&E attendances, East Sussex districts/boroughs, 2018/19 to 2022/23
Hospital activity – age specific rates & by deprivation
- In terms of children and young people, rates of emergency admissions and outpatient and A&E attendances are highest in the under 5s and then drop for 5-9 years olds who tend to have the lowest rates across all age bands.
- Rates are highest across all activity types in older people. For electives and outpatient attendances rates begin to decrease round the age of 80 years, which is generally not the case for urgent care.
Chart 30 Age-specific rates of emergency admissions, 2022/23
Chart 31 Age-specific rates of elective admissions, 2022/23
Chart 32 Age-specific rates of first outpatient attendances, 2022/23
Chart 33 Age-specific rates of A&E attendances, 2022/23
- There is a clear association of higher emergency admissions with increasing levels of deprivation and a widening of the gap in admission rates between the most and least deprived areas. Historically this was the case with elective admissions and outpatient attendances, although in more recent years this has not necessarily been the case and in 2022/23 all areas experienced similar rates.
- A&E attendance rates are highest in the most derived quintile followed by the second most deprived quintile, with the rest of East Sussex experiencing similar rates.
Chart 34 Age-standardised rates of emergency admissions by deprivation, 2011/12 to 2022/23
Chart 35 Age-standardised rates of elective admissions by deprivation, 2011/12 to 2022/23
Chart 36 Age-standardised rates of 1st outpatient attendances by deprivation, 2012/13 to 2022/23
Chart 37 Age-standardised rates of A&E attendances by deprivation, 2018/19 to 2022/23
Leading cause of admissions
- There are differences in the main causes of emergency admissions by age group.
- Respiratory conditions are the leading cause of emergency admissions in under 5s.
- In children and young people aged 5-19 and adults aged 20-64 years the leading cause of an emergency admission is signs, symptoms, and abnormal clinical/laboratory findings.
- The leading cause of emergency admissions in adults aged 65+ years is diseases of the circulatory system.
Table 22 Hastings, 0-4 years olds (top 5 causes account for 78% of emergency admissions 2022,2023)
| Top 5 disease/injury causes of emergency admissions | Number | Percentage |
|---|---|---|
| Diseases of the respiratory system | 378 | 33% |
| Symptoms, signs and abnormal clinical and laboratory findings, not elsewhere classified | 198 | 17% |
| Certain infectious and parasitic diseases | 195 | 17% |
| Injury, poisoning and certain other consequences of external causes | 61 | 5% |
| Certain conditions originating in the perinatal period | 54 | 5% |
| Total emergency admissions for all causes | 1134 |
Table 23 Hastings, 5-19 year olds (top 5 causes account for 75% of emergency admissions 2022, 2023)
| Top 5 disease/injury causes of emergency admissions | Number | Percentage |
|---|---|---|
| Symptoms, signs and abnormal clinical and laboratory findings, not elsewhere classified | 258 | 26% |
| Injury, poisoning and certain other consequences of external causes | 216 | 21% |
| Diseases of the respiratory system | 140 | 14% |
| Certain infectious and parasitic diseases | 70 | 7% |
| Diseases of the digestive system | 69 | 7% |
| Total emergency admissoins for all causes | 1010 |
Table 24 Hastings, 20-64 year olds (top 5 causes account for 63% of emergency admissions 2022, 2023)
| Top 5 disease/injury causes of emergency admissions | Number | Percentage |
|---|---|---|
| Symptoms, signs and abnormal clinical and laboratory findings, not elsewhere classified | 869 | 19% |
| Diseases of the digestive system | 636 | 14% |
| Injury, poisoning and certain other consequences of external causes | 578 | 13% |
| Diseases of the respiratory system | 413 | 9% |
| Diseases of the circulatory system | 370 | 8% |
| Total emergency admissoins for all causes | 4526 |
Table 25 Hastings, 65+ year olds (top 5 causes account for 68% of emergency admissions 2022, 2023)
| Top 5 disease/injury causes of emergency admissions | Number | Percentage |
|---|---|---|
| Diseases of the circulatory system | 741 | 16% |
| Symptoms, signs and abnormal clinical and laboratory findings, not elsewhere classified | 739 | 16% |
| Injury, poisoning and certain other consequences of external causes | 658 | 15% |
| Diseases of the respiratory system | 648 | 14% |
| Diseases of the digestive system | 407 | 9% |
| Total emergency admissoins for all causes | 4710 |
Adult social care caseload
- Hastings has highest rate of new contacts with Adult Social Care for both adults (18-64) and older people (65+) age groups.
Chart 38 – Total number of new contacts as a rate per 100,000 population, 2021/22
- Hastings has a similar percentage compared to East Sussex for older people (65+) and adults (18-64) for ‘new care’ contacts progressing to a Social Care Assessment.
Chart 39 – ‘New care’ contacts from the community that have progressed to a Social Care Assessment, 2021/22
- Hastings has a similar percentage of Social Care Assessment that resulted in Support Plans for adults and older people compared to East Sussex.
Chart 40 – Social Care Assessment that resulted in Support Plans, 2021/22
- Hastings has the highest rate for both adults (16-64) and older people (65+) with at least one activity in a 12-month period compared to the other districts and boroughs.
Chart 41 – Number of people with at least one activity in a 12-month period as a rate per 100,000 population, 2021/22
Activity relates to contacts, assessments, reviews, appearance of needs tools, other statutory work, and safeguarding episodes.
Note: East Sussex data also includes clients that were unable to be allocated to a specific district/borough.
- Hastings has the highest rate of persons receiving Long Term Support for both adults and older people.
Chart 42 – Persons receiving Long Term Support per 1,000 population, 2021/22
CSC caseload / Looked after children
- Hastings has the highest rate of looked after children and child protection plans but has the second highest referrals to children’s social care.
Chart 43 Children’s social care – Looked after Children, Child Protection plans rate per 1,000 and referrals, 2022/23