
Contents
- Key Findings
- Age structure
- Population change
- Children and young people (aged 0-17)
- Working-age people (aged 18-64)
- Older people (aged 65 and over)
- Districts
- Population change in Sussex as a whole
- Detailed components of change
- Further information
Population estimates … in brief
See the population profile for East Sussex elsewhere on ESiF.
- The population of East Sussex was estimated to be 560,882 in mid-2024.
- The number of people has increased by 0.8% (4,244 people) since mid-2023 (England and South East both up 1.2%) and by 4.3% since 2014 (England up 7.8%, SE up 8.4%). This is slightly lower than in 2023 when numbers rose by 1.0% (5,493).
- The birth rate has been declining steadily in East Sussex over the last decade, and there were 15% fewer births in 2024 than 2014. However, in the year to June 2024 there were 34 more births than in 2023.
- East Sussex has seen a negative natural change every year for at least 50 years and this pattern continues, with 2,552 more deaths than births in 2024.
- Internal net migration makes the largest contribution to population change in East Sussex. 3,988 more people moved into the county from within the UK than moved out of the county in 2024. This slightly lower than the average for the previous 10 years (2014-2023) of 4,510 net internal migration arrivals per year.
- International net migration into East Sussex was 30.6% lower in 2024 than in 2023, at 2,851, compared to 4,107 the previous year. It remains much higher than the average for the period 2013-2022, when there was average net international migration of 485 per year.
- International net migration is just higher than the number lost to natural change (births minus deaths) of -2,552.
- Rother has the second highest proportion of people aged 65 and over (32.5%), and aged 85 and over (4.9%) of all local authority districts/UAs in England, behind North Norfolk (35.0% and 5.0%). At 53.7 years, Rother has the third highest median age of all districts/UAs, behind North Norfolk (56.0 years) and East Lindsey (54.1 years). It has the highest median age out of all Sussex districts/UAs.
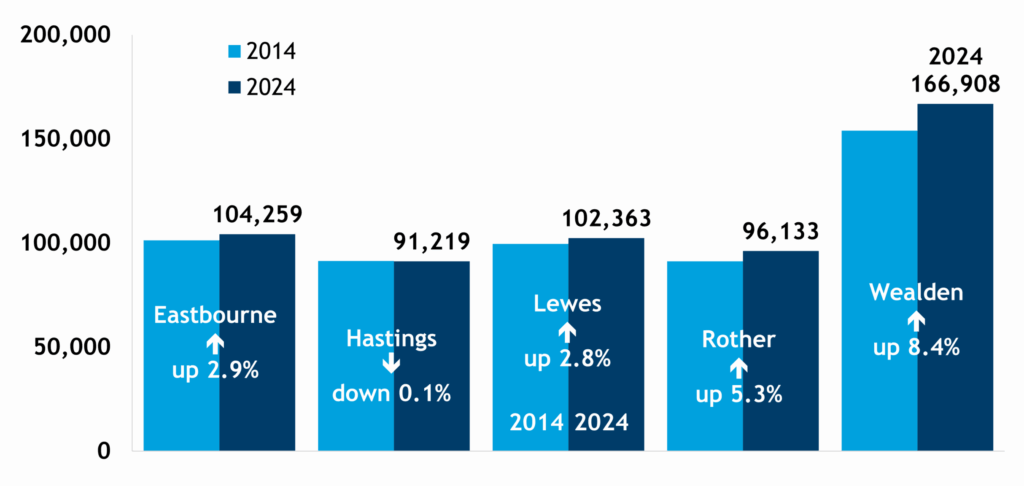
- Out of all East Sussex districts, Wealden saw the biggest population increase in the year to June 2024 with an increase of 2,047 (1.2%). It also saw the largest rise since 2014 with an increase of 12,891. At 8.4%, it was the only district in the county with a population increase over the decade higher than the national increase of 7.8%.
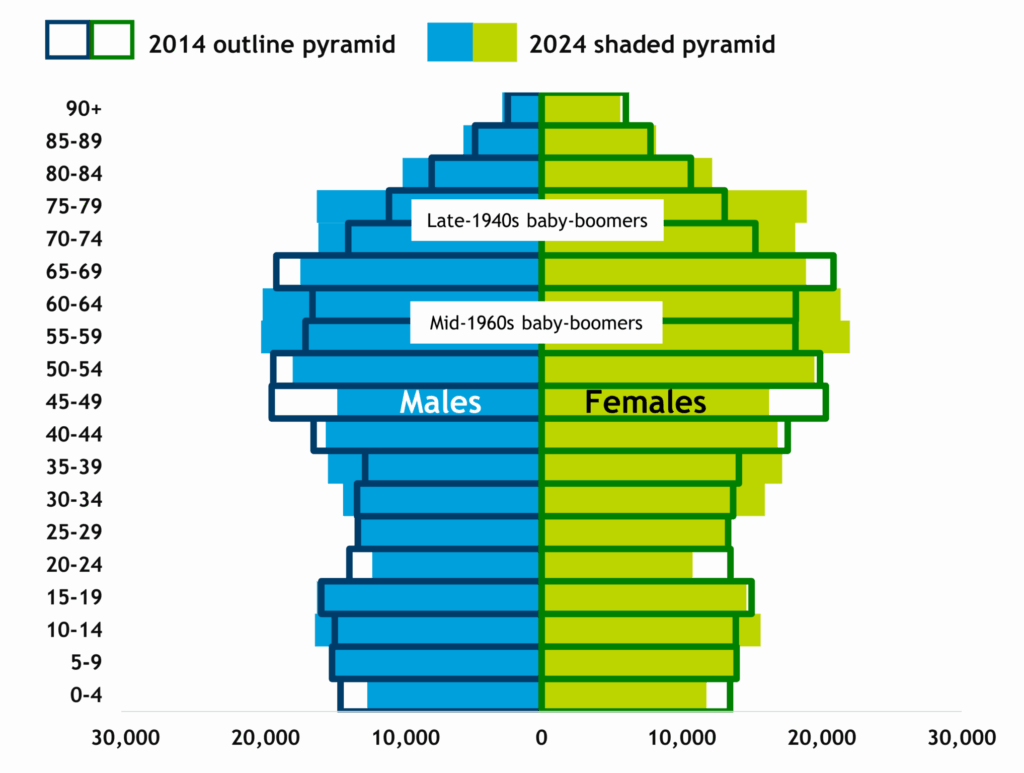
Fig. 1: East Sussex population in 2014 and 2024, by age and sex
| Population in 2023 | 556,640 |
| + Natural change | -2,550 |
| + Net migration from UK | +3,990 |
| + Net migration from overseas | +2,850 |
| + Other change | -40 |
| Population in 2024 | 560,880 |
Age Structure
- East Sussex has a much older age profile compared to England and the South East. Over a quarter (26.6%) of the county’s population is aged 65 or over (highest of all 21 shire counties, and sixth highest of all counties/UAs in the country), compared to 18.7% in England and 19.8% regionally. On the other hand, only 16.3% of the county is aged under 16, compared to 18.4% nationally and 18.5% in the South East.
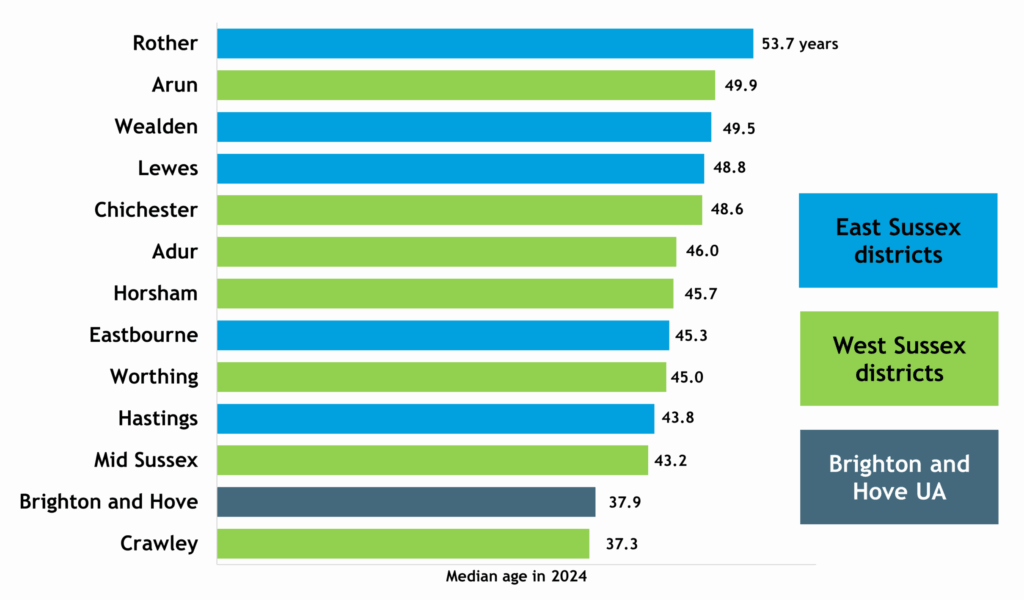
- Rother has the second highest proportion of people aged 65 and over (32.5%), and aged 85 and over (4.9%) of all local authority districts/UAs in England, behind North Norfolk (35.0% and 5.0%). At 53.7 years, Rother has the third highest median age of all districts/UAs, behind North Norfolk (56.0 years) and East Lindsey (54.1 years). It has the highest median age out of all Sussex districts/UAs.
Fig. 2. Median ages in all Sussex districts/UAs in mid 2024
- Overall, the East Sussex population has grown by 4.3% since 2014. While the population aged 65 and over has increased by 12.9%, older people aged 45-64 have risen by 2.2%, and people aged 30-44 have risen by 8.5%, there was a decline among the 18-29 age group (down 7.1%) and no change among children aged 0-17 (up 0.1%).
- There were two ‘baby booms’ in the 20th century, one just after World War II and another in the mid-1960s, which can be seen as ‘bulges’ in the population pyramid above. However, population growth in those age groups has been augmented by migration, mainly by people moving to East Sussex from within the UK.
- The overall number of children under 18 has changed little since 2014, but there are considerably fewer children aged 0-4 in 2024 than there were in 2014 (down 12.8%), with young people aged 15-19 down by 0.2%. Other groups seeing significant falls in numbers include those in the 20-24 age group (down 16.0% since 2014), and those in their late 40s (aged 45-49, down 22.0% since 2014), partly as a consequence of the population ‘bulge’ in those age groups ageing on ten years and the next age group being far less numerous.
Population change
Fig. 3: Components of population change in East Sussex, 2002-2024
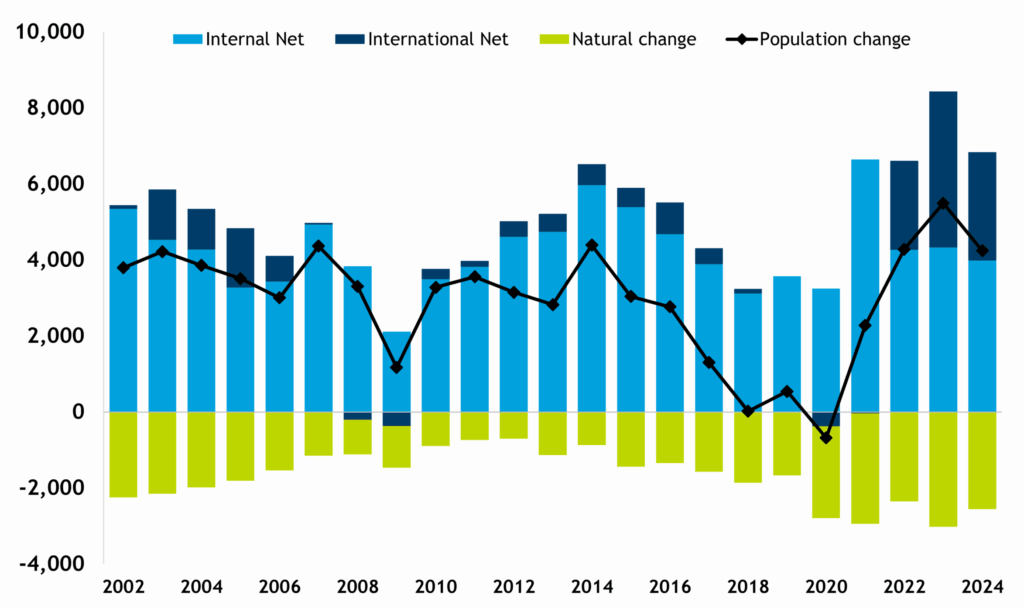
- 2024 saw lower international migration inflow than 2023 (30.6% fewer net arrivals: 2,851 compared to 4,107 in 2023), but it is still at a comparatively high level compared to the period from 2002-2021
- In the year to June 2024, there were 4,365 births (up 0.8% from 2023) and 6,917 deaths (down 5.9% from 2023), giving natural change of -2,552. All East Sussex districts also saw a negative natural change in the year to June 2024, in contrast to England and the South East where positive natural change was recorded, but at low levels at both geographies
- The decline in population due to natural change has been counteracted by levels of internal migration and, to a lesser extent, international migration (see chart above). In 2024 there was a net migration of 3,988 into East Sussex from other parts of the UK and a net migration of 2,851 people into East Sussex from abroad. Net international migration was lower in 2024 than in 2023 (4,107) but remains high compared to the average for the 10 years from 2012-2021.
- Between 2023 and 2024, the population grew in all districts, and rose the fastest in Wealden (up 1.2%). Wealden has also seen the fastest growth in the county over the past 10 years, with an increase of 8.4%. Hastings has seen a marginal decline in population over the last decade, down 0.1% since 2014, and the borough saw no change in 2024.
Table 1: Population change between 2014 and 2024
| Mid-2014 population | Mid-2024 population | Absolute change 2014-2024 | Percentage change 2014-2024 | |
| Eastbourne | 101,328 | 104,259 | 2,931 | 2.9% |
| Hastings | 91,356 | 91,219 | -137 | -0.1% |
| Lewes | 99,607 | 102,363 | 2,756 | 2.8% |
| Rother | 91,269 | 96,133 | 4,864 | 5.3% |
| Wealden | 154,017 | 166,908 | 12,891 | 8.4% |
| East Sussex | 537,577 | 560,882 | 23,305 | 4.3% |
| South East | 8,893,930 | 9,642,942 | 749,012 | 8.4% |
| England | 54,370,319 | 58,620,101 | 4,249,782 | 7.8% |
Table 2: Population change 2023-2024
| Mid-2023 population | Mid-2024 population | Absolute change 2014-2024 | Percentage change 2014-2024 | |
| Eastbourne | 103,862 | 104,259 | 397 | 0.4% |
| Hastings | 91,221 | 91,219 | -2 | 0.0% |
| Lewes | 101,605 | 102,363 | 758 | 0.7% |
| Rother | 95,089 | 96,133 | 1,044 | 1.1% |
| Wealden | 164,861 | 166,908 | 2,047 | 1.2% |
| East Sussex | 556,638 | 560,882 | 4,244 | 0.8% |
| South East | 9,529,446 | 9,642,942 | 113,496 | 1.2% |
| England | 57,932,470 | 58,620,101 | 687,631 | 1.2% |
Children and young people aged 0-17
- The population of children and young people in East Sussex has increased by just 0.1% (64 children) since 2014, from 104,364 in 2014 to 104,428 in 2024.
- Young people make up 18.6% of the total population in East Sussex in 2024. This is lower than the regional (21.0%) and national (20.8%) averages.
- Whilst the total number of children aged 0-17 rose by 0.1% in East Sussex between 2014 and 2024, in England and the South East numbers rose by 5.6% and 6.9% respectively.
- The 0-3 age group fell by 14.3% between 2014 and 2024, and saw a 1.9% fall in the year to 2024.
- Overall numbers of school-age children (aged 4-15) have risen in the county over the last decade (up 4.2%). However the number of primary aged children (4-10) fell by 0.9%, while the number of secondary age (11-15) increased by 11.3%.
- The 4-10 age group saw no change between 2023 and 2024, while there was a 1.4% rise among those aged 11-15.
- The number of sixth formers (aged 16-17) rose by 1.9% between 2014 and 2024 but rose by 2.2% in the year to 2024.
- Wealden, Rother and Eastbourne saw increases in the number of children and young people between 2014 and 2024, with numbers up by 4.0% in Wealden (up 1,224), 2.3% in Rother (361 children) and 0.9% in Eastbourne (170). But numbers fell in Hastings by 6.2% (down 1,183) and in Lewes by 2.6% (down 508).
Fig. 4: Population change among children in East Sussex, 2014-2024

Working-age people (aged 18-64)
- The population of working-age people in East Sussex has increased from 300,885 in 2014 to 307,039 in 2024, an increase of 2.0% in the decade. This compares to an increase from 2014 of 6.4% nationally and 6.5% regionally. Numbers rose by 0.5% in the year to 2024 in the county
- Working-age people make up 54.7% of the total population in East Sussex in 2024. This is lower than the regional (59.2%) and national (60.5%) averages.
- Internal migration (from within the UK) is the main driver of population change among the 18-64 age group, with a net inflow of 23,644 working age people moving into the county from the UK in the decade to 2024.
- Between 2015 and 2024, 21% of net migration of working age people in the county was from overseas (6,252 people)
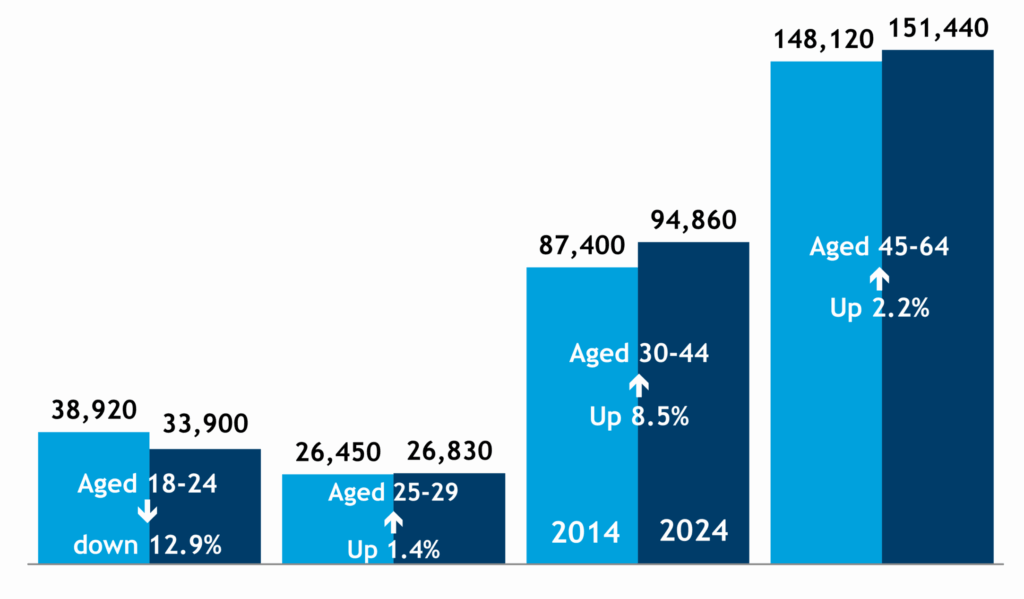
- In East Sussex numbers of young working age adults (aged 18-29) fell by 7.1% in the last decade, however this age group saw a small increase (0.8%) in the year to 2024. The decline was focused on the 18-24 age group which saw a net change of 12.9% over the ten years to 2024.
- The oldest age group 45-64 have risen 2.2% in the last decade, however this age group did see a small decline in the year to 2024, down 0.2%. The age group to see the biggest rise is the 30 to 44 year olds, with an increase of 8.5% since 2014, and an increase of 1.6% in the year to 2024.
Fig. 5: Population change among working age people, 2014-2024
Older people (aged 65 and over)
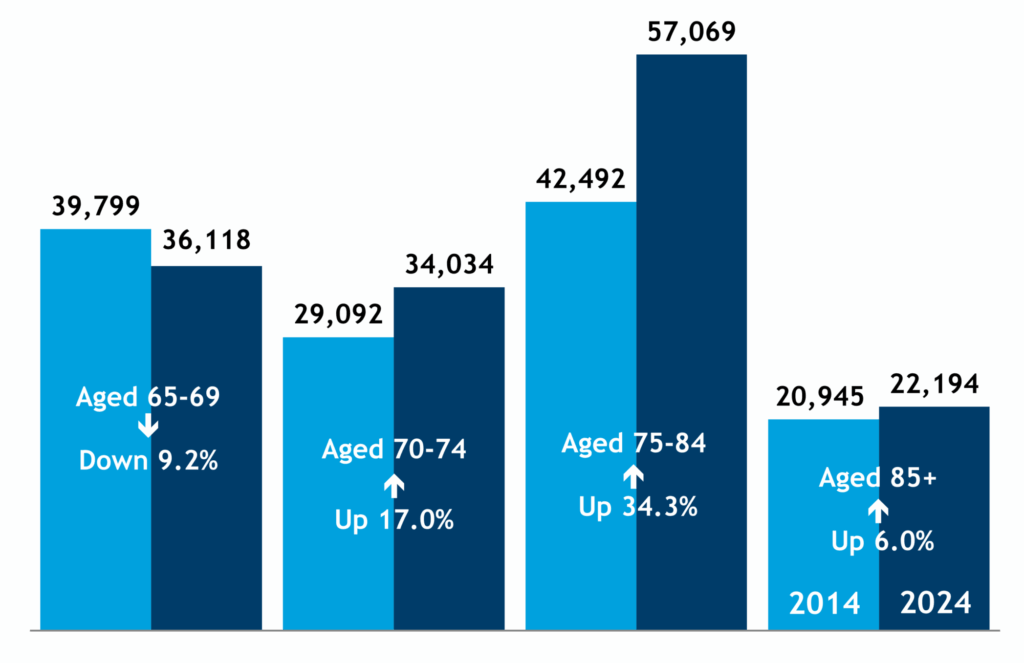
- The population of older people aged 65 and over in East Sussex has increased by 1.5% in the year to 2024 and by 12.9% since 2014 (from 132,238 in 2014 to 149,415 in 2024), a slightly smaller increase than the decade change both nationally (15.5%) and regionally (16.2%).
- Older people made up 26.6% of the total population in East Sussex in 2024. This is higher than the regional (19.8%) and national (18.7%) averages.
- 4.0% of the population in East Sussex are 85+, joint third highest of all counties/UAs, after Dorset (4.4%) and Isles of Scilly (4.2%) compared to just 2.5% nationally and 2.9% in the South East.
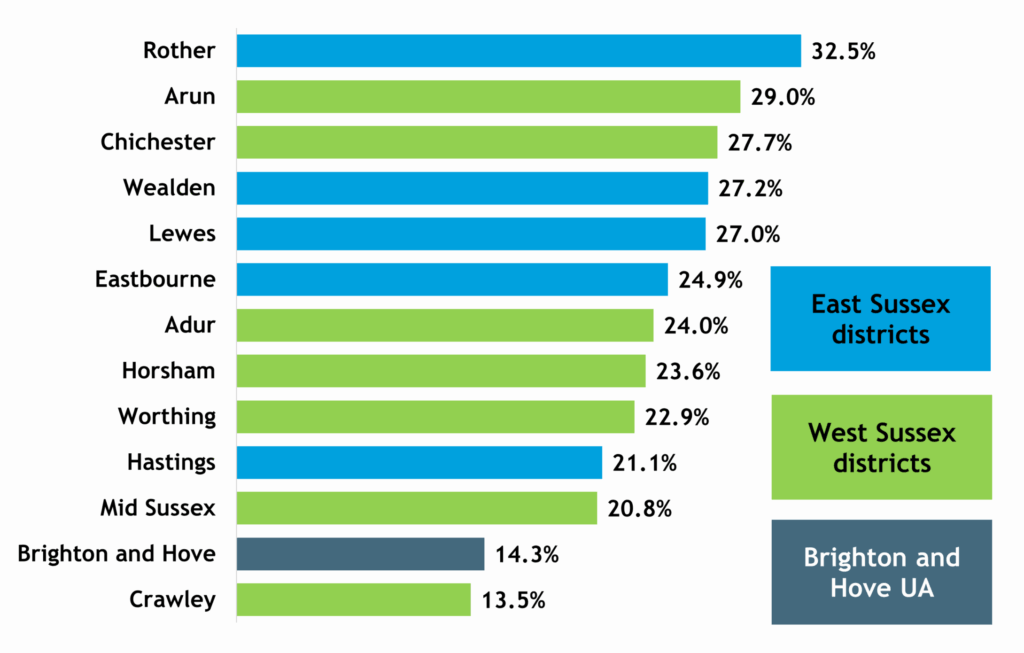
- Rother has the highest proportion of older people age 65+ and 85+ out of all districts/UAs in Sussex (East and West Sussex and Brighton and Hove)
Fig. 6: Percentage of population aged 65 and over in districts of Sussex
Rother has the joint highest population of people aged 85+ in the country (with North Norfolk and New Forest) at 4.9%, one in every 20 people.
Fig. 7: Percentage of people aged 85 and over in local authority districts and unitary authorities in England, 2023. See also Sussex area districts and UA.
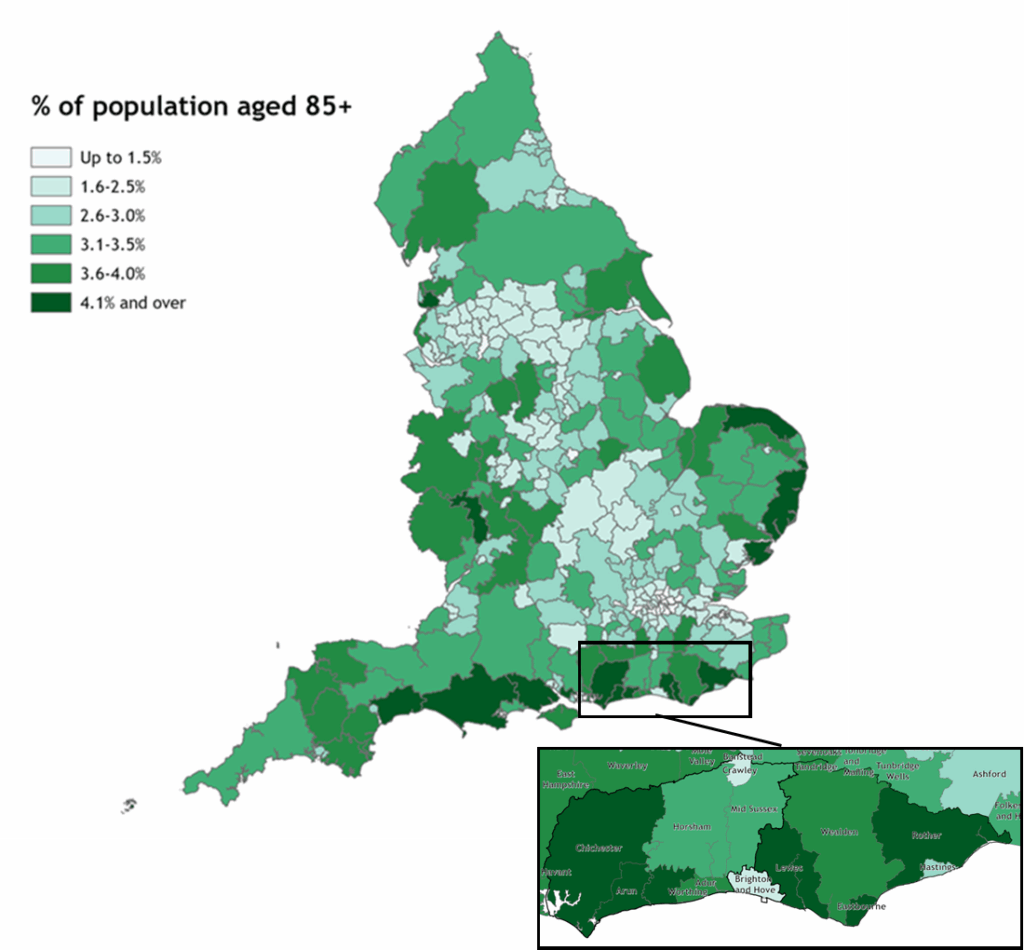
Fig. 8: Population change among those aged 65+, East Sussex 2014-2024
- Almost a third of Rother’s population (32.5%) are aged 65+, ranking second highest of all districts/UAs, behind North Norfolk. Rother also has the second highest proportion of over 85s in the country at 4.9% (just behind North Norfolk at 5.0%), with Lewes the eighth highest at 4.2%.
- Hastings has the smallest proportion of older people in the county with only 21.1% of the population being aged 65+, and 2.7% of the population being 85+ in 2024.
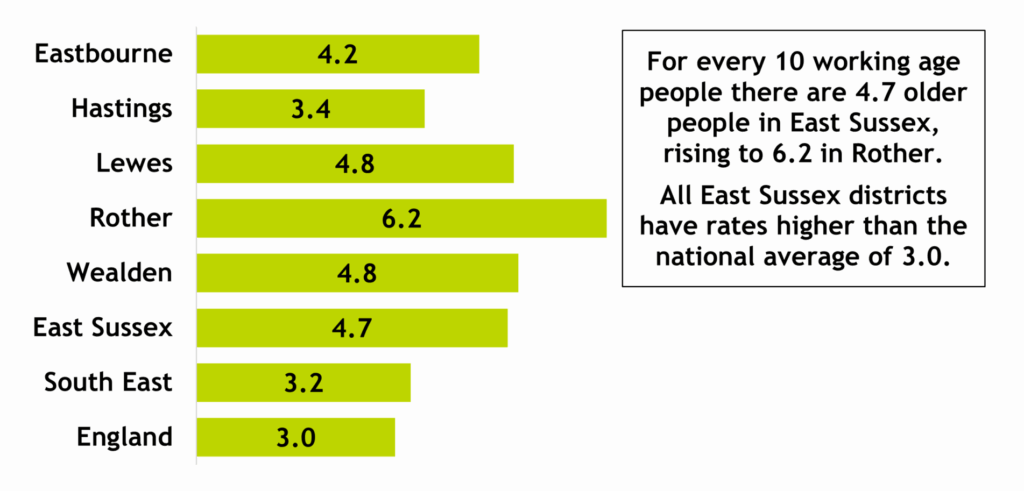
Fig. 9: Elderly dependency ratios in East Sussex districts, South East and England in 2024
Districts
Fig. 10: East Sussex population by districts in 2014 and 2024
Eastbourne
The population of Eastbourne has increased by 2.9% since 2014 (up 2,931), but this increase has been dominated by older people aged 65 and over (up 7.8% over the 10 years), and specifically the 70-79 group which increased by 26.8% over the decade to 2024. There was a decline among the youngest adult age group with 1,586 fewer people aged 18 to 29 (down 10.9%), but the 30-44 age group increased by 6.4% (up 1,144) and the 45-65 age group rose by 5.2% (1,317). There was a marginal rise in the total number of children aged 0-17 (up 0.9%). The 10-14 age group increased by 18.7% over the decade with 944 more children in this group, possibly reflecting expansion in private schools in the area. However, among the 0-4 age group there was a decline of 21.0% (1,202), while the number of births fell from 1,114 in 2014 to 826 in 2024.
Hastings
Hastings has seen the population decrease slightly by 0.1% since 2014, the only district to see a population decrease in the decade to 2024. Again, the increase has been dominated by older people with an increase of 2,249 (13.3%) among those aged 65 and over, including a 2,266 rise (33.7%) among people aged in their 70’s. This compares to a fall of 19.2% among those aged 18 to 29 (2,587 fewer people), and a decrease of 6.2% in the 0-17 age group, including a 21.8% decline among children aged 0-4.
Lewes
Overall population numbers in Lewes have risen by 2.8% since 2014, with a large rise among people aged 65+ (up 13.5% or 3,284 more people), with the largest rise among those aged 70-79 with an increase of 28.8% (2,833 people). The number of young people in the district has fallen, with a decline in the number of children aged 0-17 of 2.6% (508 fewer children), including a 16.8% fall in the number of children aged 0-4 (down 846) and an 8.3% decline in young people aged 18-29 (down 956). There has been an increase in the number of 30-44 year olds (up 5.6%) in the decade to 2024.
Rother
The population of Rother has risen by 5.3% since 2014, with a 10.7% rise among those 65 and over (3,024 more people in this age group), again dominated by the 70-79 age group which increased by 28.8% (3,268). There was an increase of 12.9% among those aged 30-44 (1,545 more people). The number of young people aged 0-17 rose by 2.3% in the decade to 2024, but there was a decline in the number of children aged 0-4 of 6.2% (244 fewer younger children), while the number of young adults aged 18-29 saw no change at all over the decade. Rother now has the second highest proportion of people aged 65 and over, and those aged 85+ of all local authorities in the country (behind North Norfolk).
Wealden
Wealden has seen the biggest rise in population in the county since 2014, of 8.4% (12,891 more people), reflecting increased housing provision in the district. The rise was dominated by older people with 17.2% more people aged 65+, and 16.6% more people aged 85 and over. But there were also rises among all other age groups, the 30-44 age group saw an increase of 12.2%, the 18-29 age group was up 3.0% and children aged 0-17 rose by 4.0% in the decade to June 2024.
Population change in Sussex as a whole
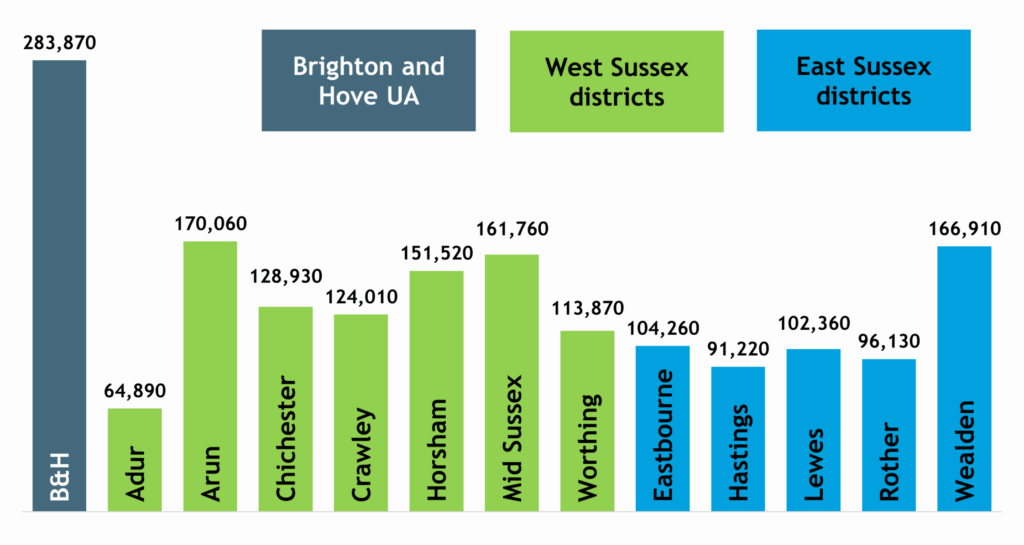
The population of the whole of Sussex, including East Sussex, West Sussex and Brighton and Hove was 1,759,789 in mid-2024. The population of the whole area grew by 1.0% over the year, and was 6.8% higher than in 2014. Over the decade, growth in East Sussex at 4.3% was lower than in West Sussex (9.7%), but higher than in Brighton and Hove (2.9%). West Sussex grew faster than England as a whole (7.8%) and the South East region (8.4%) in the 10 years from 2014 to 2024, and at the same rate as England and the South East in the year from 2023 (1.2%).
Growth in 5 of the 7 districts of West Sussex was faster than in East Sussex. Horsham saw the fastest growth of 12.9% over the decade, followed by Mid Sussex (11.9%) and Crawley (11.2%). In the year to 2024, Mid Sussex saw the highest rise in the area, an increase in population of 2.1%, but three districts in the area had the second highest growth: Wealden, Arun and Horsham (1.2%).
Hastings had the lowest growth in the area, with a decline in population over the 10 years of 0.1%, and no change in the year to 2024. But the second lowest growth in the area over both 10 year and the most recent year has been in Adur, where there were only 2.1% more people over the decade, and growth of just 0.3% over the year 2023 to 2024.
Fig. 11: Population of districts/UAs in Sussex in 2024
Detailed components of change data
Table 3: Population and components of change, East Sussex and comparator areas, 2023-2024
| East Sussex | South East | England | |
| Population mid-2023 | 556,638 | 9,529,446 | 57,932,470 |
| Births | 4,365 | 88,676 | 568,537 |
| Deaths | 6,917 | 87,507 | 530,443 |
| Natural change | -2,552 | 1,169 | 38,094 |
| Internal migration – net | 3,988 | 22,320 | -18,404 |
| International migration – net | 2,851 | 90,410 | 667,467 |
| Other* | -43 | -403 | 474 |
| Population mid-2024 | 560,882 | 9,642,942 | 58,620,101 |
*Other changes presented in this table comprise changes to the size of armed forces stationed in the UK and other special population adjustments such the prison population.
Table 4: Population and components of change in East Sussex districts, 2023–2024
| Eastbourne | Hastings | Lewes | Rother | Wealden | |
| Population mid-2023 | 103,860 | 91,220 | 101,610 | 95,090 | 164,860 |
| Births | 830 | 800 | 750 | 660 | 1,340 |
| Deaths | 1,320 | 1,060 | 1,260 | 1,470 | 1,820 |
| Natural change | -490 | -260 | -510 | -810 | -480 |
| Internal migration – net | -10 | -330 | 1,010 | 1,320 | 2,000 |
| International migration – net | 890 | 580 | 310 | 530 | 530 |
| Other* | 0 | 0 | -50 | 0 | 0 |
| Population mid-2024 | 104,260 | 91,220 | 102,360 | 96,130 | 166,910 |
Further information
The mid-year population estimates are produced annually by the Office for National Statistics (ONS) for every local authority and health area in England & Wales. The latest mid-2024 population estimates were released by ONS on 30th July 2025, alongside the detailed components of change, and revised estimates for 2022 and 2023.
This data is available by gender and age groups at district level and a useful Analysis Tool is also available from the ONS.
- For more information about mid-year population estimates see the ONS website. Data is also available to download from the Nomis website.
- Data is available in ESiF in the Population Profiles and detailed data is also available via the data explorer.
- For further information about population estimates for East Sussex, contact the Research and Intelligence team at esif@eastsussex.gov.uk.