
Median monthly employee earnings (PAYE)
East Sussex £2,407
£2,562 in UK
(August 2025, PAYE RTI)
Median weekly full-time workplace-based earnings
East Sussex £668
£732 in England
(2024, ASHE)
Median weekly full-time residence-based earnings
East Sussex £703
£732 in England
(2024, ASHE)
Headlines
PAYE RTI Data (August 2025)
- At £2,407 per calendar month (pcm)(which equates to £554 per week), monthly median employee earnings in East Sussex are 6.0% lower than the UK as a whole (£2,562 pcm).
- Annual growth has been slightly faster in East Sussex than in the UK.
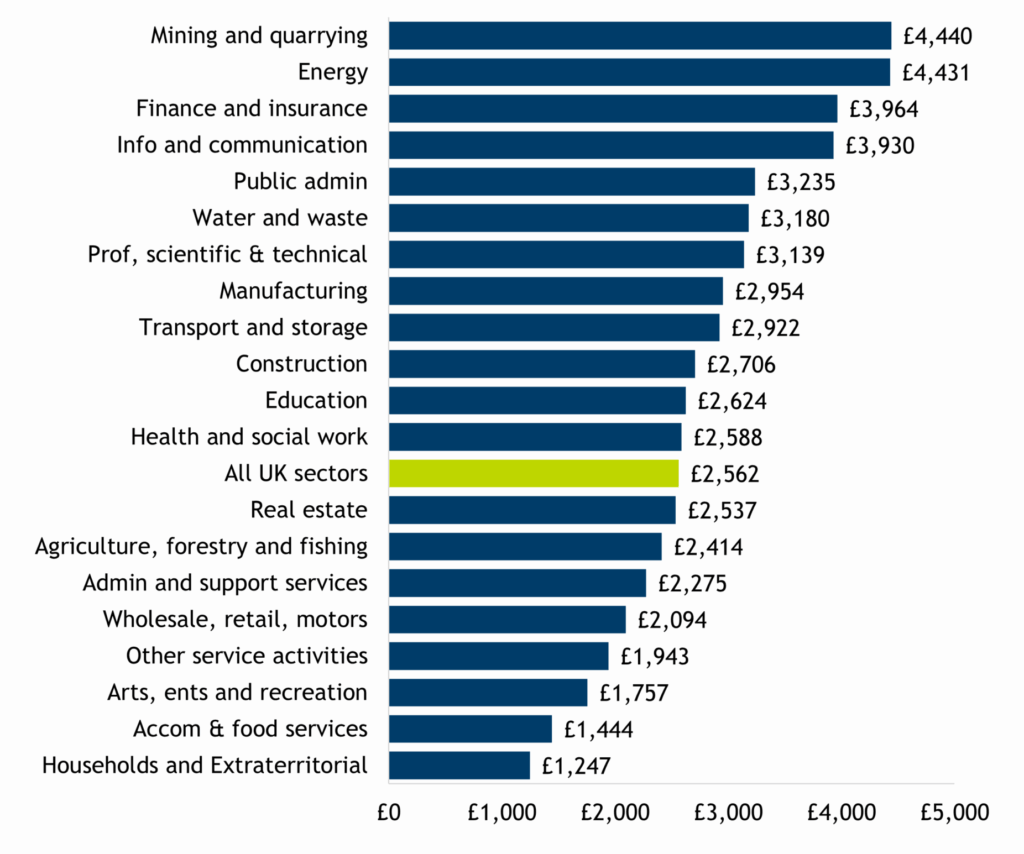
- The sector with the lowest pay in UK is Accommodation & Food Services (£1,444 pcm).
ASHE (2024)
- In East Sussex, full-time (FT) weekly residence-based earnings (£703 per week (pw)) are 5% higher than FT workplace-based (£668 pw), reflecting out-commuting.
- Full-time workplace-based earnings in East Sussex were second lowest of all counties/unitary authorities (UAs) in the South East.
- Gender Pay Gap: In East Sussex, women who work in the county earn 10% less than men full-time (weekly), lower than the national gap (14%).
Summary
Looking at the latest PAYE earnings data for payrolled employees (PAYE RTI) from the ONS, median monthly pay for all employees in East Sussex was £2,407 (pcm) in August 2025 which is equivalent to £554 per week (pw). This compares to £2,562 pcm (£590 pw) in the UK as a whole. PAYE RTI is the most up-to-date source of earnings data, is based on actual administrative data, and has recently been accredited as a National Statistic.
If we look at the Annual Survey of Hours and Earnings (ASHE), at £668 per week (pw), full-time workplace-based earnings in East Sussex in 2024 were the second lowest of all counties/Unitary Authorities (UAs) in the South East region (England £732). However by this measure, pay rose by 6.3% in the year from 2023 (England up 6.1%) and is 46.6% higher than in 2014 (higher than the England average rise of 39.8%).
Full-time residence-based earnings were £703 per week in East Sussex in 2024. This contrasts with the residence-based data for all employees living in the county from ASHE, of £575 per week in 2024, but looks similar to workplace-based data for all employees in East Sussex in 2024, £545 per week. ASHE data has more detail about employment types and sex at different geographical levels but is survey based so may not be so robust for smaller population groups.
The ONS also release data about Gross Disposable Household Income (GDHI). In 2023, GDHI per head in the county was higher than the national (UK) average – people in East Sussex had £26,616 per head Gross Disposable Household Income per year. This compares to £24,836 in the UK as a whole and £28,187 in the South East region.
PAYE Real Time Information (PAYE RTI) earnings data from ONS
Data from the ONS about median and mean monthly earnings of payrolled employees from the Pay as you Earn Real Time Information (PAYE RTI) dataset has been available since January 2020 and is published with detail for districts, industrial sectors and broad age groups (but not sex). It does not include the earnings of self-employed people. It has recently been accredited as a National Statistic.
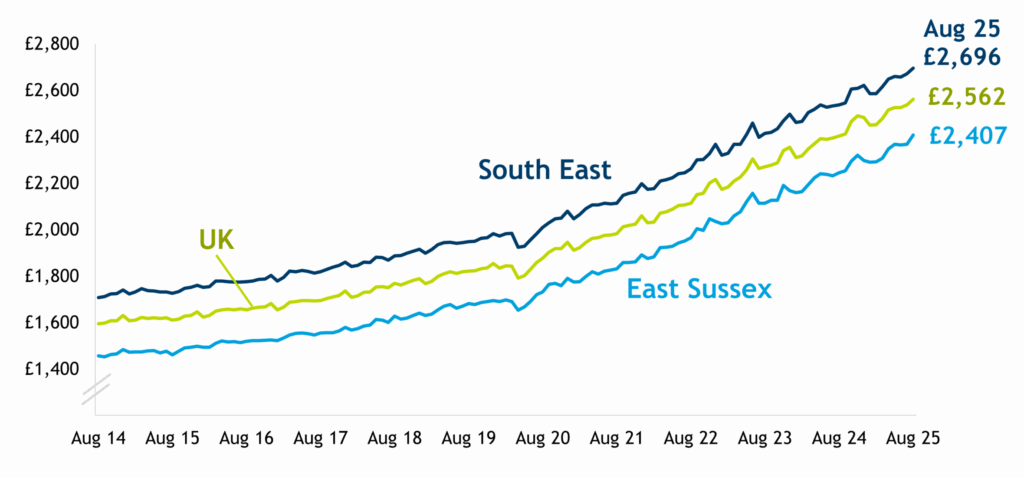
Median monthly earnings at £2,407 in the county (Aug 2025) are lower than national (UK=£2,562 per calendar month or pcm) and regional (£2,696) averages (see chart below) but saw an annual increase just above the average – up 7.2% in East Sussex and 6.6% in the UK since August 2024.
Figure 1: Median monthly pay from PAYE RTI, August 2014 to August 2025 (note y-axis does not start at zero)
Wages are lower than average in East Sussex because pay in some of the dominant sectors for employment in the county are below the national average (UK = £2,531 pcm): Wholesale, retail and motors (£2,094 pcm) and Accommodation and Food service activities (£1,444 pcm). Pay is lowest in the Accommodation and Food sector (excl. Household sector) (see chart below).
Figure 2: Median monthly pay by industry (PAYE RTI) in the UK, August 2025
Annual Survey of Hours and Earnings (ASHE)
The Annual Survey of Hours and Earnings (ASHE) is an ONS survey of employers and provides data with more detail about employment types and sex at different geographical levels. Because it is survey-based the data may not be so robust for smaller population groups, such as part-time workers, districts and sexes. The sample sizes for Annual and Hourly data are smaller than for weekly pay. It does not include the earnings of self-employed people.
Full-time median pay
Figure 3: Full-time median weekly pay, residence- and workplace-based, East Sussex and comparators, 2014-2024 (note that y-axis does not start at zero)
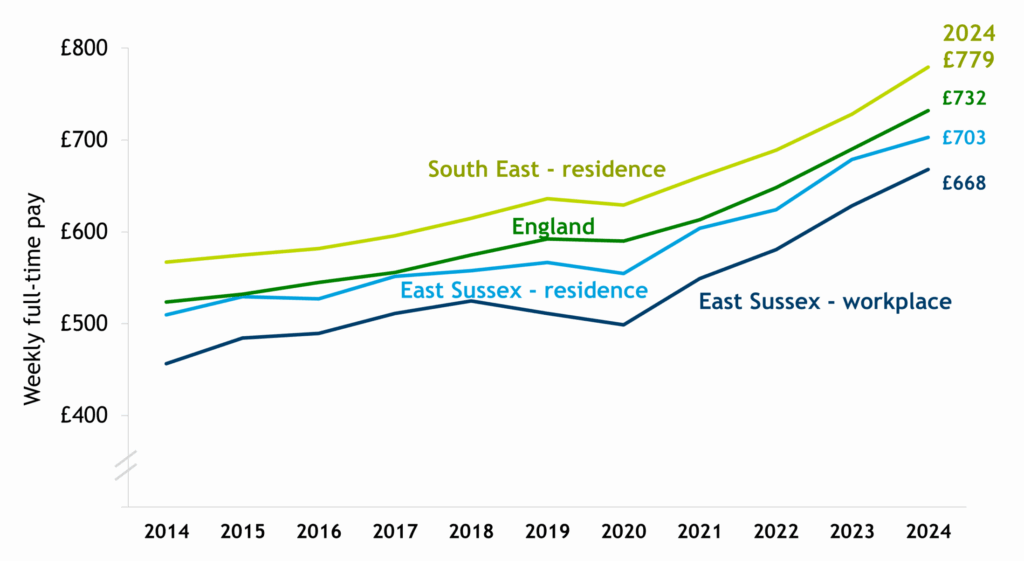
In 2024 the gross average (median) wage for a full-time job in East Sussex was £668 per week (‘workplace-based’). This is 11% lower than the South East average of £754 and 9% lower than the figure for England (£732 pw).
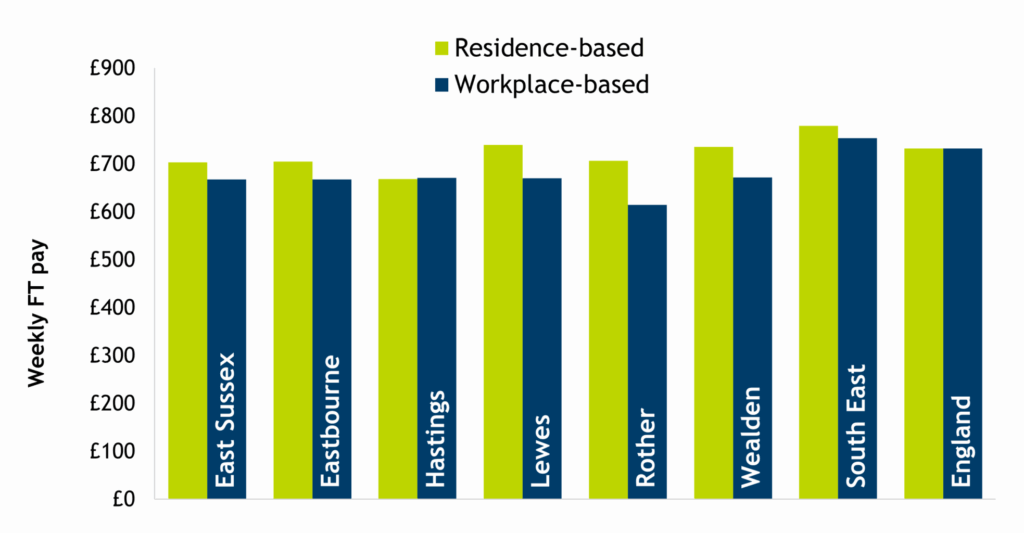
The gross average pay for full-time workers who live in East Sussex (‘residence-based’) was £703 per week, 5% higher than workplace-based pay, reflecting relatively high levels of out-commuting to better paid jobs in some districts (see chart below). Residence-based full-time pay is 4% below the national average of £732.
Figure 4: Workplace-based compared to residence-based full-time weekly pay in 2024
The increase of 6.3% in workplace-based weekly full-time pay between 2023 and 2024 continues the recent pattern of increases since 2020, which reversed a fall between 2018 and 2020. Rising workplace- and residence-based (up 3.6%) pay in the year to 2024 compares to the annual CPIH (includes housing) inflation in April 2024 which was 3.0%.
All Sussex districts and counties/UAs
In 2024, at upper tier authority level (UTLA), Brighton and Hove (B&H – £725 pw) and West Sussex county (£720 pw) had higher rates of full-time workplace-based pay than East Sussex (£668 pw). All Sussex UTLAs had higher rates of residence-based pay than residence-based pay, reflecting high levels of commuting out to better paid work, with full-time B&H residents earning £748 pw, West Sussex residents earning £746 pw and East Sussex residents earning £703 pw.
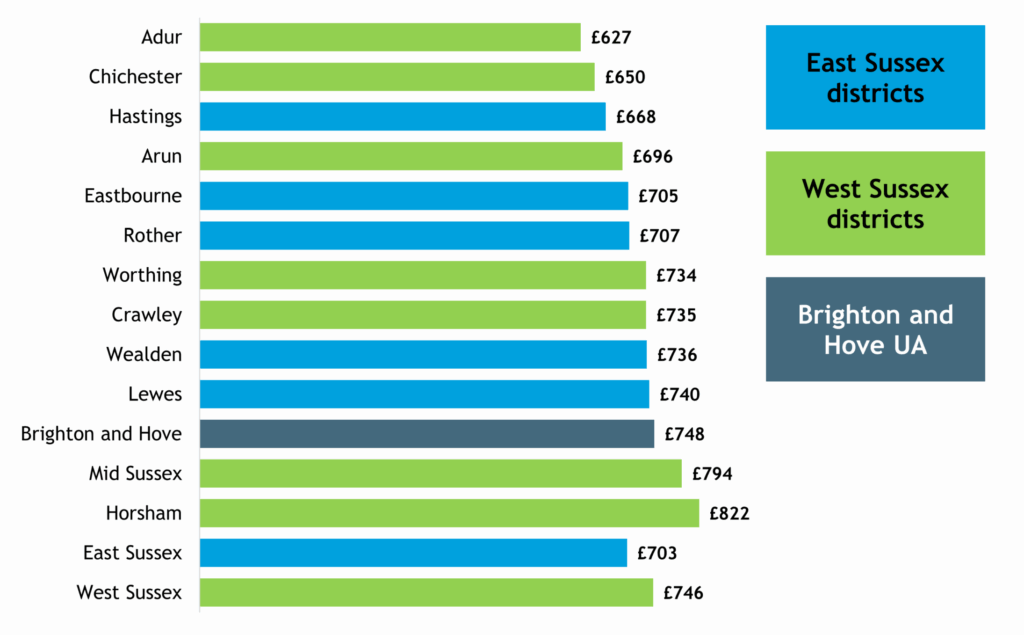
At district level, in 2024, Rother had the lowest workplace-based full-time pay (£614 pw) in Sussex (East Sussex, West Sussex and B&H), but Adur has the lowest residence-based pay (£627), with much higher workplace pay (£721 pw) in that district.
Crawley had the highest full-time workplace pay of any district/unitary authority in Sussex, with workers there earning £862 pw, perhaps reflecting the higher paid jobs available in the aviation industry as Gatwick is located in that area. Crawley residence-based pay (£735 pw) is considerably lower than the workplace-based earnings.
Horsham residents earn the highest full-time wages – £822 pw, reflecting very high commuting levels out of the area, while workplace pay there is only £677 pw.
Mid Sussex district has the second highest full-time workplace pay (£740 pw) and resident’s pay (£794 pw) of all districts/UAs in Sussex, and Brighton and Hove has both the third highest workplace pay (£725 pw) and resident’s pay (£748 pw).
Figure 5: Full-time weekly workplace-based earnings in districts of East and West Sussex and Brighton & Hove, 2024
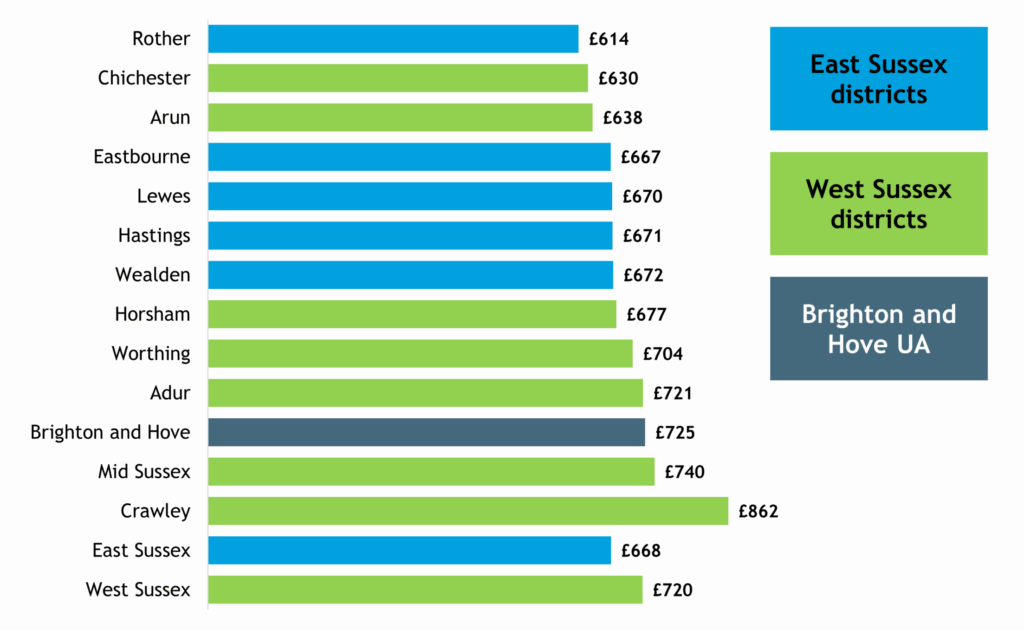
Figure 6: Full-time weekly residence-based earnings in districts of East and West Sussex and Brighton & Hove, 2024
Annual pay
Annual pay is calculated slightly differently and at lower levels of geography such as district is much less robust. In 2024 annual earnings for people who work in the county full-time were £32,703, 13% lower than the national average annual pay of £37,630.
For residents who work full-time, the figure was £35,298, 6% lower than the nation as a whole. Annual workplace-based pay was 7% lower than annual residence-based pay, which compares to weekly pay data where workplace-based pay was 5% lower than weekly residence-based earnings
Gender pay gap
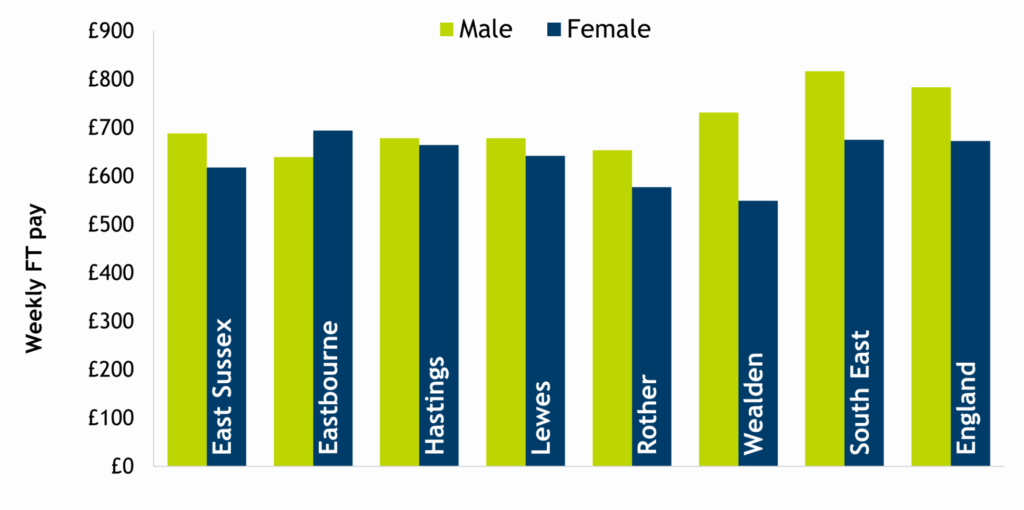
Full-time females working in East Sussex earn £618 per week, which is 10% lower than the earnings of their male counterparts (£689), but this gender pay gap in weekly pay is considerably lower than the national average gender pay gap (14%). If we look at hourly pay, the gender pay gap in the county declines to 5% (compared to 9% in England as a whole).
In Eastbourne in 2024, while overall workplace-based pay was lower than average, workplace-based pay for women, at £694 per week was 9% higher than for men (£639 pw). Weekly male FT workplace pay in Eastbourne was second lowest in the South East (behind the Isle of Wight), but FT female pay in the borough was above the national (£672) and regional (£675) averages.
Wealden has the largest gender pay gap for workplace-based full-time pay – female full-time workers earn only £549pw, 75% of the pay of their male counterparts, and male FT pay, at £732 pw, is the highest in the county.
Figure 7: Male compared to female full-time weekly, workplace-based pay in 2024, East Sussex, districts and comparators
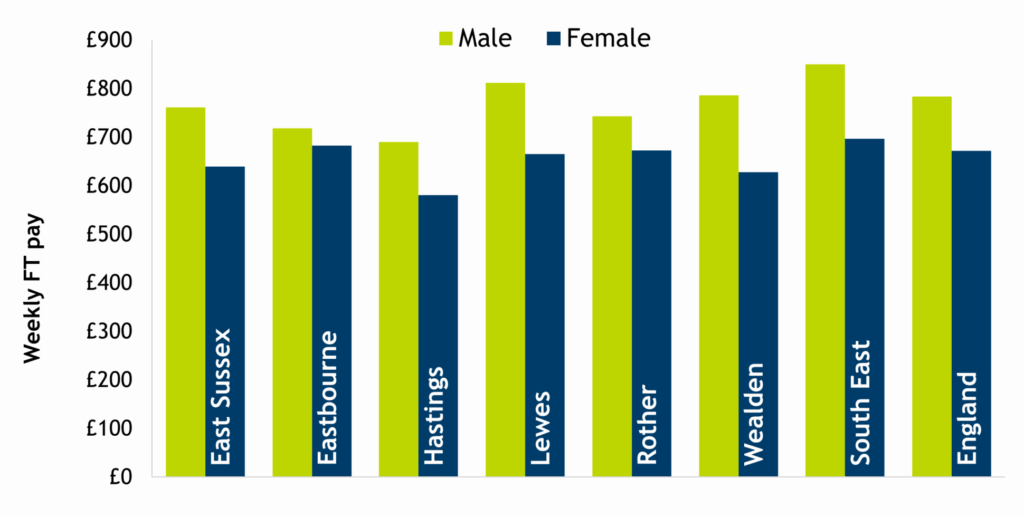
The gender pay gap for full-time residence-based pay is larger than for workers in the county, with female residents earning 16% less than males, compared to 10% for workers in the county. The largest residence-based gender pay gap is also in Wealden, where FT women earn 20% less than men resident in the district. Eastbourne has the lowest pay gap for residents, but female residents of the borough earn 5% less than their male counterparts.
Figure 8: Male compared to female full-time weekly, residence-based pay in 2024, East Sussex, districts and comparators
PAYE RTI data compared to ASHE
Each data source on incomes and pay has different strengths and weaknesses. ASHE is the ONS’s key source of data on wages and is an “accredited official statistic”. PAYE RTI has recently also been designated as an “accredited official statistic”. However ASHE data is survey-based and at lower geographical levels, and among smaller population groups (males/females, or part-time workers) the data may have particularly large confidence intervals – so not be very reliable. By comparison PAYE RTI data covers the whole population of employees paid through PAYE, rather than a sample of people or companies; this enables estimates to be produced for small sub-groups of the employee population, for example at district level, to a much greater degree of accuracy. It is also much more timely.
If we look at weekly pay for all workers from ASHE (i.e. not only full-time), for workplace and residence-based pay in 2024, and compare it to RTI PAYE data for April 2024 (RTI converted from monthly to weekly pay for comparison) we can see that in East Sussex, districts and Brighton and Hove, workplace-based and residence-based pay for all workers is somewhat higher than the median PAYE-RTI figures (see figure 8 below).
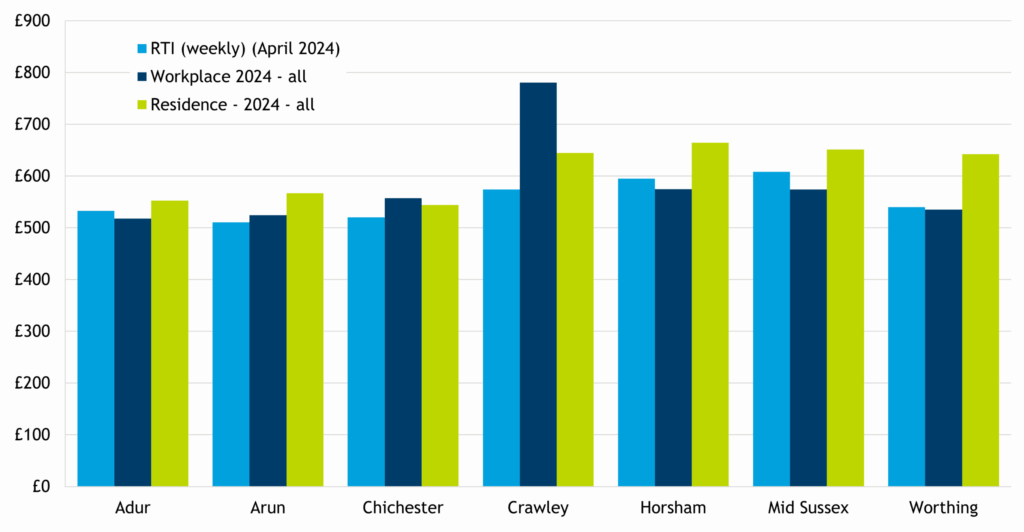
This compares to district in West Sussex, where RTI pay is higher than workplace pay in Adur, Horsham, Mid Sussex and Worthing (see figure 9 below).
Figure 9: RTI data (converted to weekly), Workplace and Residence-based data for all employees, districts of East Sussex and Brighton and Hove
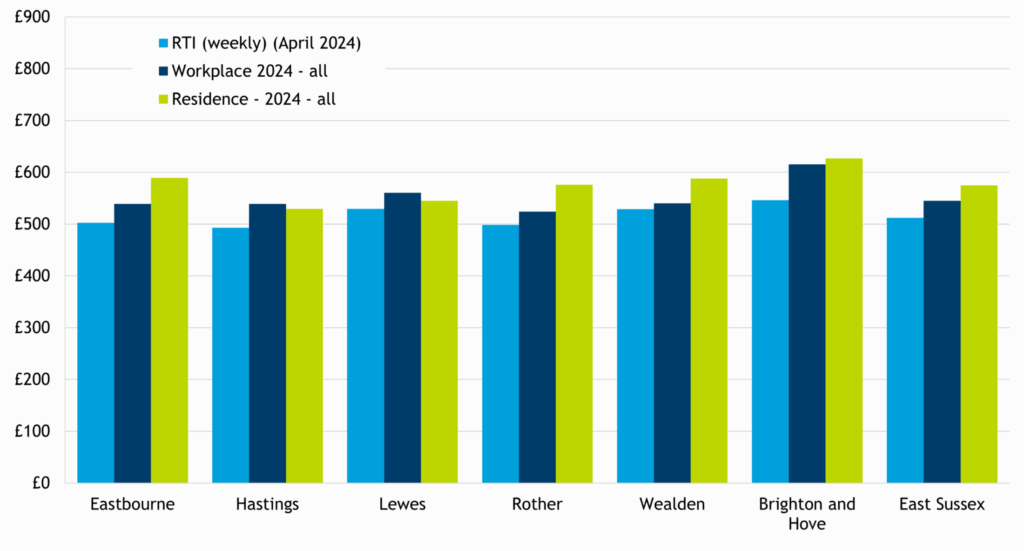
Figure 10: RTI data (converted to weekly), Workplace and Residence-based data for all employees, districts of West Sussex
Gross Disposable Household Income (GDHI)
In 2023 it is estimated that people in East Sussex had £26,616 per head Gross Disposable Household Income per year. This is higher than the figure of £24,836 for the UK as a whole but lower than £28,187 in the South East region.
GDHI includes income received by household members of all ages from all sources, such as earnings, benefits and pensions. This also includes imputed rental for owner occupiers based on property values (see further information for an explanation of this). It also includes all expenses such as property expenses such as mortgages and rent, taxes and social security contributions. The GDHI data series is currently designated “Official statistics in development”.
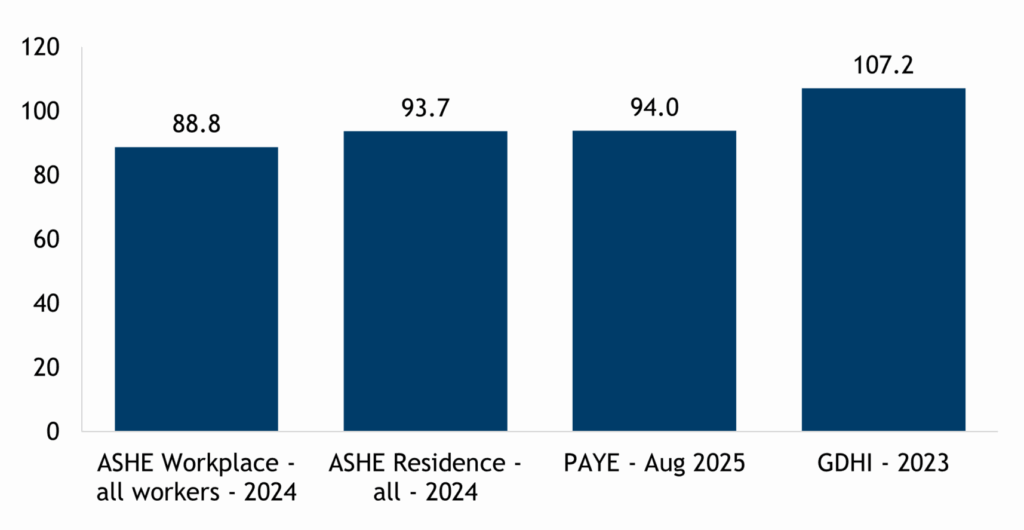
GDHI per head in the county is higher than the national (UK) average, whereas both workplace and residence-based weekly wages measured by ASHE, and PAYE RTI pay are lower than the UK. This may reflect the fact that East Sussex has a higher than average proportion of self-employed workers, who are not included in either the PAYE or the ASHE earnings data.
Figure 11: Gross Disposable Household Income (GDHI) in 2023, East Sussex, districts and comparators
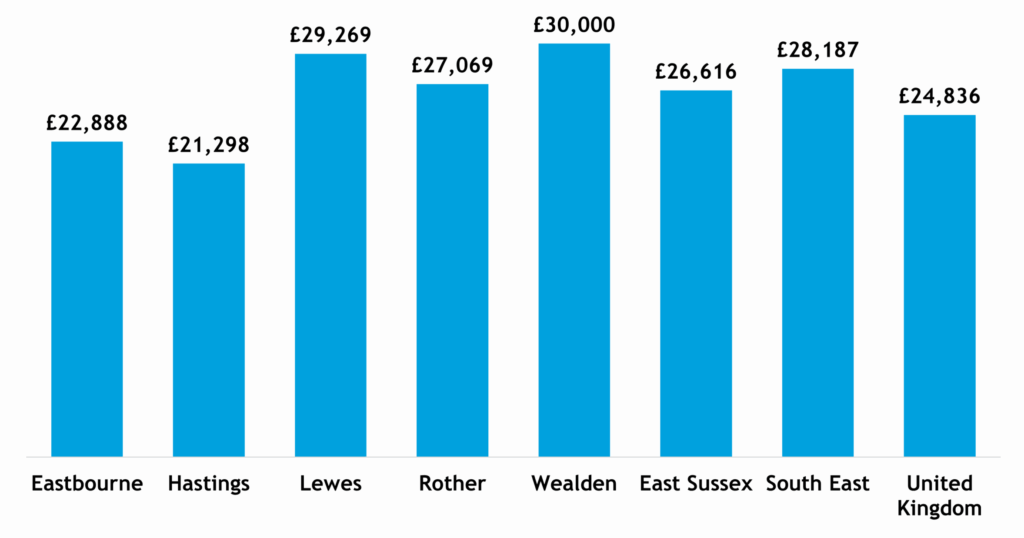
Figure 12: Index UK=100: Gross Disposable Household Income (GDHI) in 2023, Workplace- and Residence-based weekly pay for all workers in 2024, and PAYE RTI (August 2025)
GDHI per head in East Sussex rose by 8.5% in the year 2022-2023, which was a similar increase to the 8.4% increase in the UK as a whole. But there was more variation among the districts over the year – the lowest rise in GDHI was in Eastbourne (6.5%), while Lewes saw an annual increase of 10.8%.
Tables
Table 1: ASHE workplace-based pay in 2024
| Male full-time workers | Female full-time workers | All full-time workers | All workers | |
|---|---|---|---|---|
| Eastbourne | £639 | £694 | £667 | £539 |
| Hastings | £679 | £664 | £671 | £539 |
| Lewes | £679 | £642 | £670 | £560 |
| Rother | £654 | £577 | £614 | £524 |
| Wealden | £732 | £549 | £672 | £540 |
| East Sussex | £689 | £618 | £668 | £545 |
| South East | £817 | £675 | £754 | £634 |
| England | £784 | £672 | £732 | £620 |
Table 2: ASHE residence-based in 2024
| Male full-time workers | Female full-time workers | All full-time workers | All workers | |
|---|---|---|---|---|
| Eastbourne | £718 | £682 | £705 | £589 |
| Hastings | £690 | £581 | £668 | £530 |
| Lewes | £812 | £666 | £740 | £545 |
| Rother | £743 | £673 | £707 | £576 |
| Wealden | £787 | £628 | £736 | £588 |
| East Sussex | £762 | £639 | £703 | £575 |
| South East | £850 | £696 | £779 | £655 |
| England | £784 | £672 | £732 | £619 |
Table 3: PAYE Real Time Information (RTI) earnings data from ONS
| May 2023 | May 2024 | May 2025 | % change May 2024-25 | |
|---|---|---|---|---|
| Eastbourne | £2,083 | £2,202 | £2,332 | 5.9% |
| Hastings | £2,048 | £2,159 | £2,286 | 5.9% |
| Lewes | £2,184 | £2,317 | £2,447 | 5.6% |
| Rother | £2,050 | £2,172 | £2,299 | 5.8% |
| Wealden | £2,204 | £2,312 | £2,440 | 5.5% |
| East Sussex | £2,121 | £2,240 | £2,368 | 5.7% |
| South East | £2,410 | £2,537 | £2,667 | 5.1% |
| UK | £2,258 | £2,391 | £2,531 | 5.9% |
Table 4: Gross Disposable Household Income (GDHI)
| 2021 | 2022 | 2023 | % change 2022-2023 | |
|---|---|---|---|---|
| Eastbourne | £20,850 | £21,497 | £22,888 | 6.5% |
| Hastings | £18,944 | £19,813 | £21,298 | 7.5% |
| Lewes | £24,233 | £26,411 | £29,269 | 10.8% |
| Rother | £23,452 | £24,813 | £27,069 | 9.1% |
| Wealden | £26,486 | £27,749 | £30,000 | 8.1% |
| East Sussex | £23,253 | £24,537 | £26,616 | 8.5% |
| South East | £24,693 | £26,066 | £28,187 | 8.1% |
| United Kingdom | £21,729 | £22,907 | £24,836 | 8.4% |
Further information
The Office for National Statistics have published some detailed guidance explaining the relationship between income and earnings data and outlining the statistics produced by the Office for National Statistics, Department for Work and Pensions and HM Revenue and Customs – see: Income and earnings statistics guide
The Annual Survey of Hours and Earnings (ASHE) is based on a sample of employee jobs taken from HM Revenue & Customs PAYE records (designated as an accredited official statistic). Information on earnings and hours is obtained in confidence from employers. ASHE does not cover the self-employed nor does it cover employees not paid during the reference period. Most district level and especially detailed data for sex and full- or part-time working has a 10-20% coefficient of variation. This may be due to small sample sizes or proportionate non-response rates from some survey respondents. This means that district level results should be treated with caution. In addition, ONS have labelled the 2024 results as provisional and revised the 2023 figures with the 2024 data release.
Median pay is determined by ranking all wages in ascending order. The median is the mid-point of this ranking with 50 per cent of wages below the median and 50 per cent above. The median is accepted as the best average to use as mean average may be skewed by a small number of very large figures for income.
Looking at full-time pay, rather than pay for all workers, enables better comparison as the data will not be affected by areas where more people work part-time.
ASHE data is available as hourly, weekly or annual pay, for full-, part-time and all workers and for males and females. However, the data for hourly and annual pay has very large confidence intervals (especially for smaller groups such as part-time workers, and at district level) and looks somewhat different to the weekly pay data which is more robust and reliable, so we have focussed on weekly data in this analysis, while including a reference to the annual pay data.
Resident earnings in East Sussex exceed employee earnings as a result of out-commuting – people travelling to work outside the county, for example to London, to secure higher wages.
For more information about ASHE data visit the ONS website.
East Sussex in Figures has detailed data about workplace-based and residence-based earnings from ASHE.
Earnings and employment data is obtained from the ONS’ Pay As You Earn (PAYE) Real Time Information (RTI) series. The PAYE RTI series was redesignated as an Accredited National Statistic in July 2025. Data for the number of employees and monthly earnings data are available for the whole country from the ONS, and are updated monthly, with lower tier local authority data released quarterly.
Gross Disposable Household Income (GDHI) data is published by the ONS and designated as “official statistics in development”. Gross disposable household income is the amount of money that all the individuals in the household sector have available for spending or saving after they have paid direct and indirect taxes and received any direct benefits. GDHI is a concept that is seen to reflect the “material welfare” of the household sector. The household sector includes residents of traditional households, as well as those living in communal establishments. GDHI also includes the business income of self-employed people.[KB2]
GDHI includes Owner-occupiers’ imputed rental (OOIR). OOIR is an estimate of the housing services consumed by households who are not actually renting their residence. It can be thought of as the amount that non-renters pay themselves for the housing services that they produce.
As such, imputed rental should represent the economic value per period to home owners of their dwellings, equivalent to if they were to rent out their properties. By definition, however, a homeowner does not receive payment on their property, and so the payment must be “imputed”.
Detail about how GDHI is calculated is available in their Quality and methodology information and analysis of the national data is published in a bulletin.
For information about Benefit claimants and unemployment, see our latest briefings on Local Reports: Economy, skills and employment.
For further information about earnings and income, and other labour market data please contact the team by email: esif@eastsussex.gov.uk.