
Claimants … in brief
December 2025
Key Findings:
- Claimant Count (people seeking work): There were 11,415 unemployed claimants of Job Seekers Allowance (JSA) and Universal Credit (UC – searching for work conditionality) in November 2025 (3.6% of working age people).
- Unemployed UC/JSA claimant numbers declined slightly by 0.3% (40 fewer claimants) in the year from November 2024 but increased by 3.3% (up 360 claimants) in the month to November 2025. The claimant rate in East Sussex (3.6%) remains lower than national (England) figure of 4.0%.
- Universal Credit (people on low incomes): There were 62,820 people claiming any UC in November 2025 (19.2% of people aged 16-65), of whom 51,929 are not included in the Claimant Count above (i.e. not ‘Searching for work’ conditionality).
- The number of UC claimants has seen an annual rise of 14.9% since November 2024. This is an increase of 8,125 claimants.
- Note that the migration of claimants to Universal Credit from other benefits such as Employment and Support Allowance (ESA) has been accelerated in the last year.
In East Sussex, overall unemployed claimant numbers have decreased by 0.3% over the past year, from 11,455 in November 2024 to 11,415 in November 2025. This compares to England, where the annual decline in claimant numbers was 3.1%.
There were 3.6% of working age people in East Sussex claiming UC/JSA in November 2025, lower than England rate (4.0%), but higher than the South East region (3.1%).
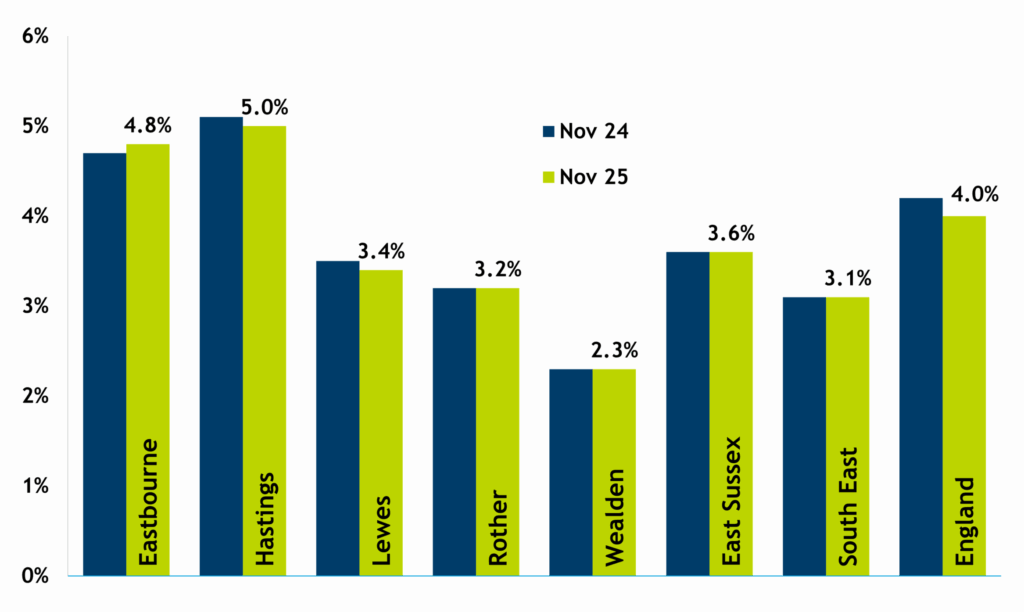
Claimant rates, in East Sussex, districts, and comparators, November 2024 and November 2025
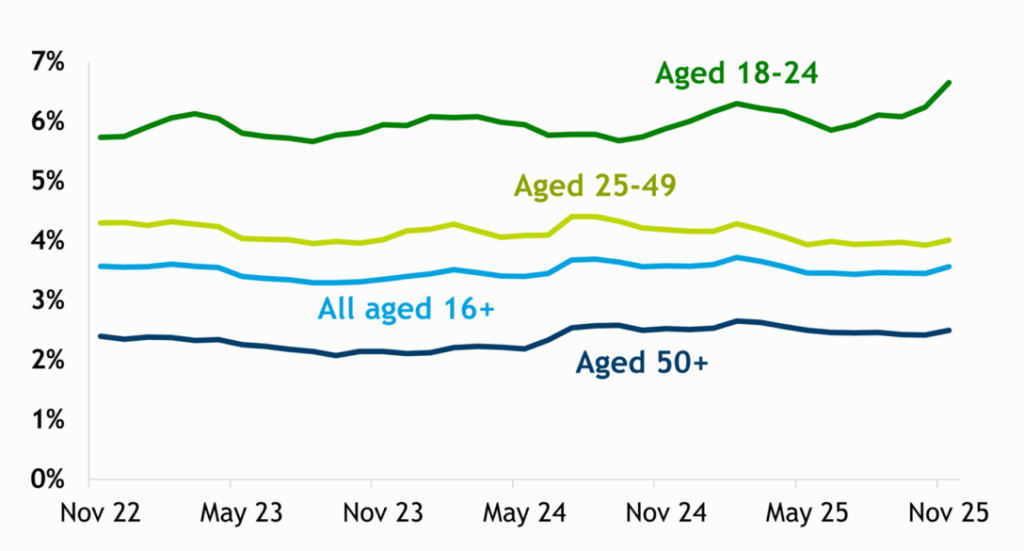
Youth unemployment is rising faster than other ages
Youth unemployment saw a significant increase in the year to November 2025. The number of UC/JSA claimants aged 18-24 in East Sussex rose from 1,995 in November 2024 to 2,255 in November 2025, an increase of 13.0%. This is significantly higher than the national rise of 10.2% among young claimants over the same period. Rates fell between February and June 2025, but have been rising since then, and reached the highest rate in November 2025 (6.7%) since the post pandemic period in December 2021 (6.8%).
6.7% of people aged 18-24 in East Sussex are now claiming UC/JSA (November 2025), with numbers up by 6.6% (140 claimants) in the month since October 2025, a larger increase than in England as a whole (up 2.8%). The number of young male claimants by rose by 16.7% in the year, from 1,195 in November 2024 to 1,395 in November 2025. Young female claimants rose more modestly, by 7.5% over the year from 800 to 860 in November 2025. The claimant rate among young men at 7.8% is considerably higher than young females (5.3%).
The highest levels of youth claiming are seen in Hastings, where 9.8% of young people are claiming UC/JSA, including 11.6% of young males in November 2025. Numbers in Hastings rose by 9.5% in the month to November 2025. Youth claiming is also rising fast in other districts – in Rother there were 22% more young claimants in November 2025 (310) than in November 2024 (255), Wealden has seen a 19% annual rise (from 335 to 400) and in Eastbourne numbers rose by 16%.Youth claimant rates are above the national average (5.8%) in Eastbourne (7.9%), Lewes (6.3%) and Rother (6.0%). 9.2% of young males aged 18-24 in Eastbourne were claiming UC/JSA because they were unemployed in November 2025.
Claimant rates by age group, East Sussex, November 2022-2025
Number of unemployed claimants of UC/JSA
| November 2024 | November 2025 | Actual change | Annual % change | |
| Eastbourne | 2,850 | 2,905 | 55 | 1.9% |
| Hastings | 2,875 | 2,775 | -100 | -3.5% |
| Lewes | 2,030 | 1,930 | -100 | -4.9% |
| Rother | 1,605 | 1,615 | 10 | 0.6% |
| Wealden | 2,095 | 2,185 | 90 | 4.3% |
| East Sussex | 11,455 | 11,415 | -40 | -0.3% |
| South East | 181,825 | 182,605 | 780 | 0.4% |
| England | 1,511,445 | 1,464,030 | -47,415 | -3.1% |
Percentage of working age people claiming UC/JSA because of unemployment
| November 2023 | November 2024 | November 2025 | |
| Eastbourne | 4.3% | 4.7% | 4.8% |
| Hastings | 5.2% | 5.1% | 5.0% |
| Lewes | 3.0% | 3.5% | 3.4% |
| Rother | 3.1% | 3.2% | 3.2% |
| Wealden | 2.0% | 2.3% | 2.3% |
| East Sussex | 3.4% | 3.6% | 3.6% |
| South East | 2.8% | 3.1% | 3.1% |
| England | 3.7% | 4.2% | 4.0% |
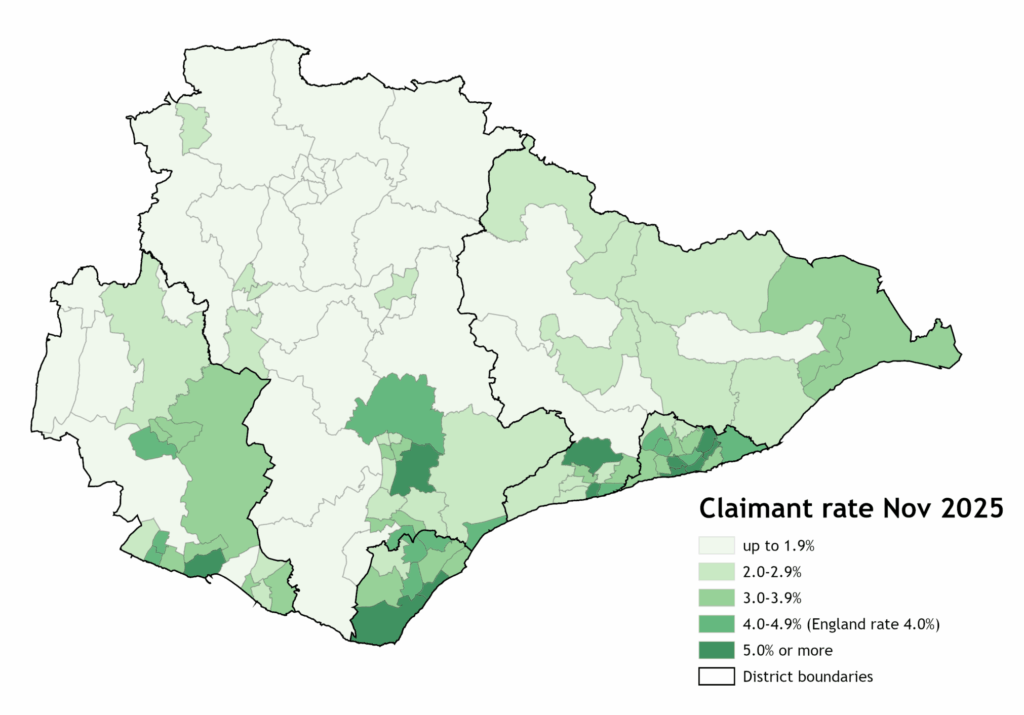
Claimant rate by ward in November 2025
Wards
In November 2025, 25 East Sussex wards had rates at or above the England average (4.0%), with the highest rates in Devonshire (9.0%) in Eastbourne, and Central St Leonards (7.5%), Gensing (7.0%) and Castle (6.9%) in Hastings.
This includes 9 wards in Hastings, 5 in Eastbourne, 4 in Lewes, 3 in Rother and 4 in Wealden.
55 wards saw an increase in claimant numbers in the month to June 2025, while 16 wards saw a decline.
Claimant rate at ward level in ESiF Data explorer
Districts
Claimant counts rose in all districts in November 2025 with the highest rise in Hastings (up 150 or 5.7%), a rise of 65 in Eastbourne (2.3%), and rises of 50 each in Lewes (up 2.7%) and Wealden (up 2.3%).
However, while Wealden saw a significant annual increase in claimant numbers over the year (up 90 or 4.3%), in other districts the annual rises were more modest (Eastbourne up 55 or 1.9% and Rother up 10, or 0.6% over the year), and in Lewes and Hastings there were fewer claimants, with a decline of 100 claimants (4.9%) in Lewes and also 100 in Hastings (down 3.5%). This compares to a decrease in England of 3.3% and a slight rise in the South East region of 0.4%.
In November 2025 Hastings had the highest claimant rate in the county with 5.0% of working age people claiming UC/JSA because of unemployment. The rate is now only just higher than Eastbourne at 4.8% of the working age population, compared to 4.0% nationally.
Hastings still has the third highest claimant rate in the South East region, behind Slough (6.1%) and Thanet (5.4%). Eastbourne has the fourth highest claimant rate (4.8%) in the region.
Universal Credit Claimants
In East Sussex in November 2025 there were 62,820 people claiming UC (19.2% of working age people). This was an increase 1,170 since October 2025 (up 1.9%) and up 8,125 (14.9%) since November 2024. In October 2025, 32.1% of all UC claimants were in employment (measured by employment indicator – data not yet available for November).
Note that one of the reasons that the number of Universal Credit (UC) claimants is rising is because of the migration of claimants of other benefits such as Tax Credits, Employment and Support Allowance and Housing benefit, into the UC regime. This migration has been rolled out more assertively this year.
In the year to May 2025, there was an increase of 7,300 Universal Credit claimants. Over the same period, the number of ESA claimants declined by 24% overall, but income-based ESA claimants (who are being migrated to UC) are down by nearly half (48%) since May 2024, 3,500 fewer over the year. Between May 2024 and May 2025 there were 3,800 fewer Housing Benefit (HB) claims among working age people. And there were 5,600 families on Tax Credits (TC) in 2024 (no more up to date data is available), all of whom should be migrated very soon. A number of these claimants would overlap under the previous regime (e.g. ESA or TC claimants may also have been entitled to claim HB), but it is likely that much of the big increase in UC claims over the past year will actually reflect the numbers being migrated from other benefits.
UC claimant numbers and rates in November 2025
| Number of UC claimants in November 2025 | % of age 16-65 claiming UC in November 2025 | |
| Eastbourne | 14,619 | 23.4% |
| Hastings | 15,864 | 27.7% |
| Lewes | 10,493 | 17.6% |
| Rother | 9,774 | 18.7% |
| Wealden | 12,069 | 12.5% |
| East Sussex | 62,820 | 19.2% |
Change in number of UC claimants
| Change in UC numbers November 2024-25 | % change in UC numbers November 2024-25 | Change in UC October 2025 -November 2025 | % change October 2025 -November 2025 | |
| Eastbourne | 1,924 | 15.2% | 229 | 1.6% |
| Hastings | 1,996 | 14.4% | 300 | 1.9% |
| Lewes | 1.333 | 14.6% | 233 | 2.3% |
| Rother | 1,267 | 14.9% | 167 | 1.7% |
| Wealden | 1,608 | 15.4% | 242 | 2.0% |
| East Sussex | 8,125 | 14.9% | 1,170 | 1.9% |
Number of Universal Credit claimants by conditionality, November 2022-2025
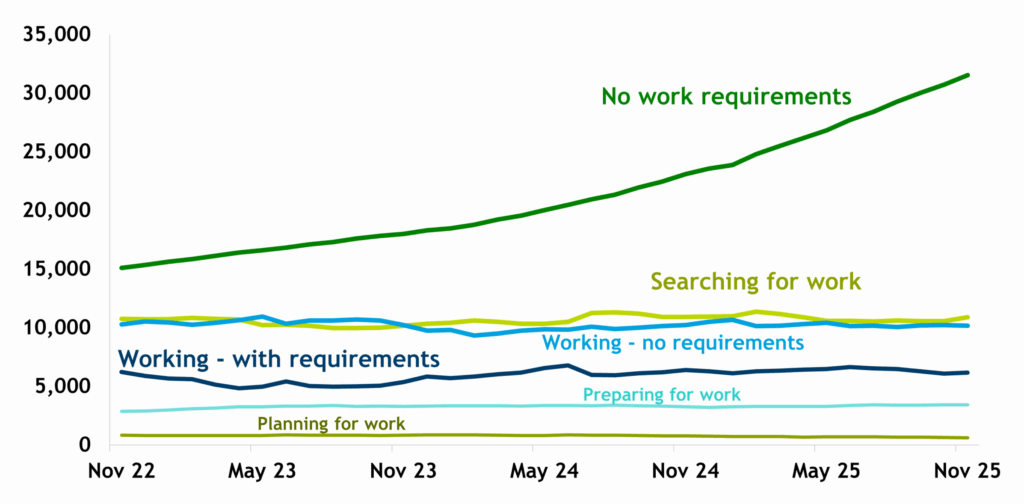
In the year to November 2025 there were increases among the No Work Requirements (8,432 more claimants, up 36.5%) and Preparing for Work (190 more – up 5.8%) groups but numbers in the Searching for work group declined by 0.4% (down 44) and there were also decreases in the ‘Planning for work’ (down 171 or 22.0%), ‘Working with requirements’ (down 233, 3.6%) and Working – no requirements (down 59 claimants, 0.6%) groups. Many people in this group will be claiming because of ill health (see paragraph on health claimants below for more information).
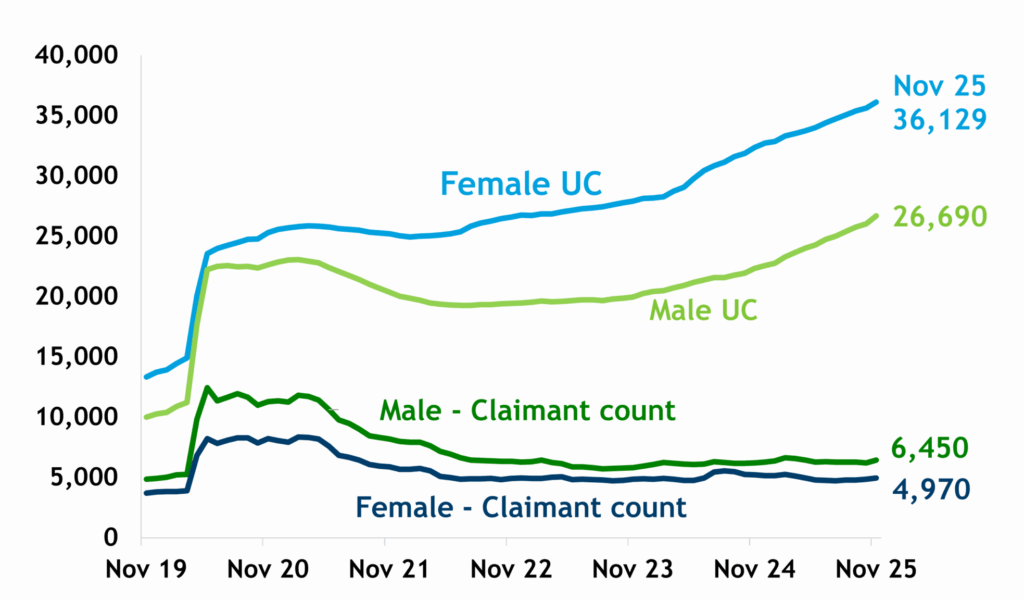
While the number of male unemployed UC/JSA claimants is higher than the number of female claimants (see dark green: male and dark blue: female lines, labelled ‘Claimant count’, in the chart below), the number of female claimants in all UC conditionality groups (light blue line) is much higher than the number of males (light green line) claiming. UC claimant numbers of both sexes continue to rise.
Male and female claimants of Universal Credit and UC/JSA unemployed claimant count, November 2019 – November 2025, East Sussex
Universal Credit Health caseload
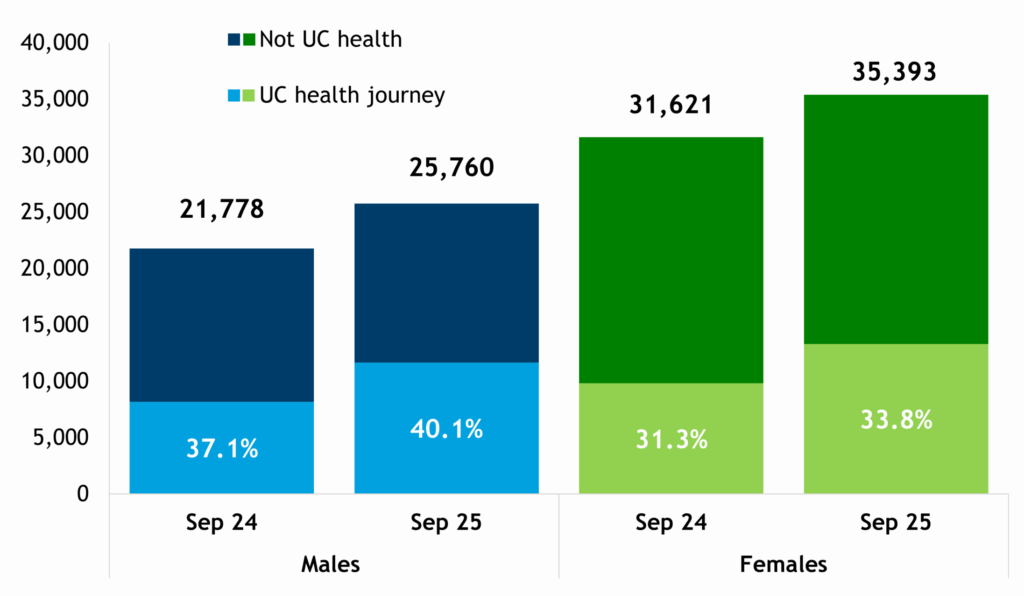
In September 2025, there were 61,150 people claiming Universal Credit (UC) in East Sussex, and of these 40.8% (24,977 claimants) were receiving UC because they had a health condition or disability restricting their ability to work. While the overall number of UC claimants rose by 14.5% in the year to September 2025, the number of claimants who were receiving UC because of a health problem increased by 38.7% over the year. This may well reflect the number of people on health related benefits like ESA being migrated to UC this year.
Although a higher number of women are claiming UC than men, 45.3% of male UC claimants in September 2025 were claiming for health reasons, compared to 37.6% of female claimants.
Total UC claimants by health journey and sex, September 2024 and September 2025
Further information
The Claimant Count measures the number of people who have made claims for benefits for reasons of unemployment. Most new claimants for benefit receive Universal Credit, but there are some claimants who do not qualify for UC because they have savings of over £16,000, who may be entitled to contributions-based JSA, which is not means-tested.
The main Claimant Count, which includes all JSA claimants and all UC claimants in the ‘searching for work’ conditionality group, gives an up-to-date measure of changes to the number of unemployed claimants. A small number of UC claimants may subsequently be reallocated to other conditionality groups.
To qualify for JSA or UC as a job seeker, claimants must meet certain eligibility criteria which include being available for, and actively seeking, work. Some claimants might do some work (less than 16 hours per week) and still be eligible if their earnings are very low, as long as they continue to meet all the UC work-seeking requirements. JSA claimants include those claiming only National Insurance credits.
The Claimant rate is defined as the number of claimants resident in an area expressed as a percentage of the working age population, which includes all people aged 16-64. Rates for other age groups use the population of that age group. Population figures are derived from the latest Office for National Statistics (ONS) mid-year population estimates.
The Claimant Count is often used as an indicative measure of unemployment as it provides frequently updated information for a range of geographies. Care should be taken not to confuse this with ONS official labour market statistics which use the International Labour Organisation’s definition of the unemployment rate, which includes all those aged 16 plus who are out of work, but actively seeking work, including those claiming no benefits, as a percentage of all Economically Active people aged 16 and over. These are based on the Labour Force Survey and Annual Population Survey, which is less statistically robust at county and district level.
Links to other useful resources
Contact details
For further information about unemployment, benefits, claimants and other labour market data please contact esif@eastsussex.gov.uk.