Economic performance…in brief
Gross Value Added (GVA) and sub-regional productivity
Key points
- In 2022, the economy of East Sussex generated £10.7 billion GVA, an increase of 6.3% since 2021, and 51.6% since 2012. Total GVA grew faster than the national (UK) rise over the 10 years 2012-22 (47.9%), but slower in the year to 2022 (UK up 9.6%).
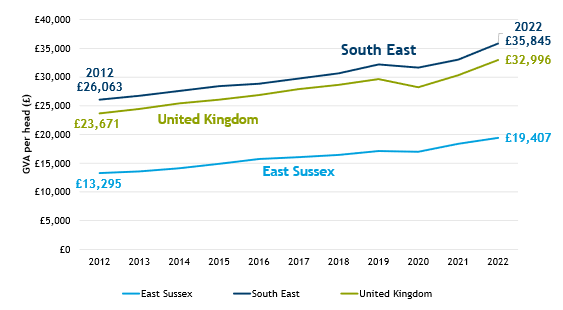
- At £19,397, GVA per head in the county has grown by 45.9% since 2012. This is higher than growth of 39.4% in the UK as a whole and 37.5% in the SE region.
- GVA per head increased by 5.5% over the year to 2022, from £18,378 in 2021, smaller than the national rise in 2021-2022 (UK up 8.7%). It is currently just 58.8% of the UK figure of £32,996 per head.
- However, GVA per hour worked, at £31.9 in the county, was closer to the national average (80.4% of UK figure – £39.7). GVA per filled job was £45,250, 73.3% of the UK average.
- Real estate is the largest sector in the county at 24% of GVA. This includes ‘Owner-occupied imputed rental’ (OOIR), which reflects property prices in an area. We can take away OOIR from the total. If we do this, Health and social care (10.5%), Wholesale, retail and motors (10.3%), and Construction (8.3%) are the largest sectors.
- There is much variation at district level, especially when OOIR is not included. For example, Health and Social care makes up 17% of the GVA of Eastbourne and 16% in Hastings, compared to 7% in Wealden and Lewes.
Definition: Gross Value Added (GVA) measures the value of goods and services produced in the local economy. It excludes brought-in materials and services. GVA per head is the total GVA, divided by the total population of an area. If we want to look at regional economic performance, ONS recommends the use of other measures of economic productivity, rather than GVA per head. These are: GVA per hour worked or GVA per job. These are better measures of the productivity of the workforce in East Sussex. This is because the county has a greater proportion of retired people than the national average.
Figure 1: Chart showing total GVA in 2022 in East Sussex and Districts
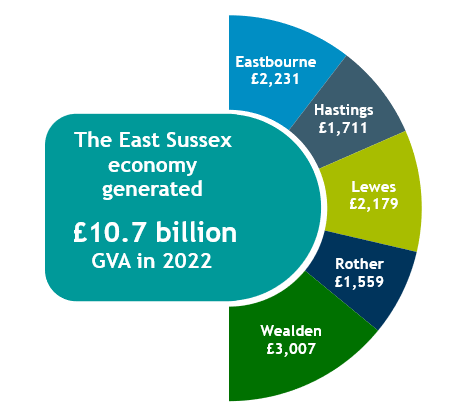
Figure 2: Chart showing GVA per head, 2012-2022, East Sussex, UK and South East region
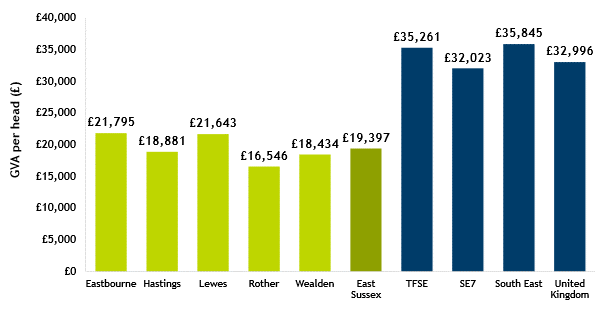
GVA per head in Transport for South East area (TfSE) and the South East 7 group of authorities (SE7) is higher than in East Sussex. At £35,261 per head in 2022, the GVA of TfSE is almost double that of the East Sussex and is higher than the UK average (see chart below).
Figure 3: Chart showing GVA per head in East Sussex, districts and comparators 2022
GVA at district level
At £21,795, Eastbourne has the highest GVA per head in the county, 66.1% of the UK average. It is 44.3% higher than in 2012, and 4.9% higher than in 2021.
Hastings saw GVA per head rise by 41.7% between 2012 and 2022, to £18,881. Over the year to 2022, GVA per head rose by 3.4%, a more modest increase than the county as a whole (5.5%).
Lewes has the second highest GVA per head in the county at £21,643 (just below Eastbourne), 65.6% of the UK average. This has increased by 57.8% since 2012, and rose by 9.8% between 2021 and 2022. This was higher than both the county increase (5.5%) and the national rise of 8.7%.
At just £16,546, Rother has the lowest GVA per head in the county, sixteenth lowest in England. It is only 50.1% of the national figure. GVA per head increased by 49.8% between 2012 and 2022. The district saw a modest rise of 3.2% in the year to 2022, the lowest increase out of all the county’s districts.
Wealden has seen its GVA per head increase by 40.1% since 2012, to £18,434 in 2022. There was a rise of 5.6% in the year to 2022, from £17,460 in 2021.
Table 1: GVA per head in 2012, 2017, 2021 and 2022
| 2012 | 2017 | 2021 | 2022 | |
| Eastbourne | £15,102 | £17,822 | £20,777 | £21,795 |
| Hastings | £13,327 | £16,225 | £18,258 | £18,881 |
| Lewes | £13,711 | £17,195 | £19,707 | £21,643 |
| Rother | £11,043 | £13,358 | £16,037 | £16,546 |
| Wealden | £13,153 | £15,718 | £17,460 | £18,434 |
| East Sussex | £13,295 | £16,071 | £18,378 | £19,397 |
Table 2: Percentage change in GVA per head, since 2012, 2017, 2021
| 2012-2022 | 2017-2022 | 2021-2022 | |
| Eastbourne | 44.3% | 22.3% | 4.9% |
| Hastings | 41.7% | 16.4% | 3.4% |
| Lewes | 57.8% | 25.9% | 9.8% |
| Rother | 49.8% | 23.9% | 3.2% |
| Wealden | 40.1% | 17.3% | 5.6% |
| East Sussex | 45.9% | 20.7% | 5.5% |
Sub-regional productivity
East Sussex has a much older population than other parts of the UK. 26.5% of the population are aged 65+ compared to an average 18.7% in England as a whole. This means that there are fewer people of working age generating economic value. Other measures of economic output might give a less distorted picture economic performance. In East Sussex these other productivity measures are GVA per job and GVA per hour worked. The difference between the county and other geographies is much smaller when looking at these measures compared to GVA per head. GVA per hour and per job are still considerably lower than the average in England and the South East region.
Table 3: GVA per head, per job and per hour in 2022 – East Sussex and higher geographies
| East Sussex | South East | England | UK (less extra regio) | |
| GVA per head | £19,397 | £35,845 | £33,976 | £32,996 |
| GVA per job | £45,250 | £68,021 | £68,021 | £68,021 |
| GVA per hour | £31.9 | £44.4 | £40.3 | £39.7 |
Figure 4: GVA per head, per job and per hour in 2022, indices where UK=100, East Sussex and comparators
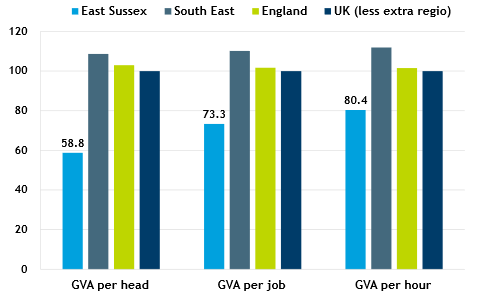
Table 4: GVA per head, per job and per hour in 2022 – East Sussex and districts
| GVA per head | GVA per job | GVA per hour | |
| Eastbourne | £21,795 | £44,089 | £30.90 |
| Hastings | £18,881 | £45,355 | £31.40 |
| Lewes | £21,643 | £46,823 | £33.10 |
| Rother | £16,546 | £41,570 | £28.90 |
| Wealden | £18,434 | £47,534 | £33.90 |
| East Sussex | £19,397 | £45,250 | £31.90 |
Table 5: Comparison of Indices: GVA per head, per job and per hour in 2022, UK=100
| GVA per head | GVA per job | GVA per hour | |
| Eastbourne | 66.1 | 71.4 | 77.8 |
| Hastings | 57.2 | 73.5 | 79.1 |
| Lewes | 65.6 | 75.9 | 83.4 |
| Rother | 50.1 | 67.3 | 72.8 |
| Wealden | 55.9 | 77.0 | 85.4 |
| East Sussex | 58.8 | 73.3 | 80.4 |
In Rother, total GVA per head is much lower than other areas. But when we look at other productivity measures, such as GVA per hour worked, the difference with other areas is much lower. This is because these measures take account of the area’s older population.
GVA per head in Wealden appears low in contrast to other economic measures for the district. These include things like average residence-based earnings. This is because many workers in Wealden commute out of the district to work, for example to London. This means that the GVA they generate accrues to the area where they work, rather than their home.
Figure 5: Chart showing GVA per filled job (smoothed) in East Sussex, districts and comparators, 2022
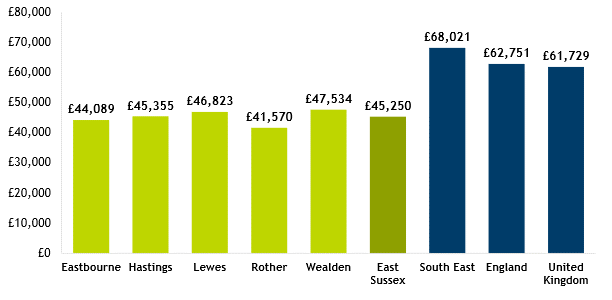
Table 6: GVA per filled job (smoothed) in 2012, 2017, 2021 and 2022
| 2012 | 2017 | 2021 | 2022 | |
| Eastbourne | £34,454 | £38,777 | £44,527 | £44,089 |
| Hastings | £34,155 | £39,998 | £44,192 | £45,355 |
| Lewes | £36,135 | £40,864 | £45,332 | £46,823 |
| Rother | £31,891 | £36,862 | £40,793 | £41,570 |
| Wealden | £34,321 | £38,562 | £45,823 | £47,534 |
| East Sussex | £34,257 | £38,950 | £44,285 | £45,250 |
Figure 6: Chart showing GVA per hour worked (smoothed) in East Sussex, districts and comparators, 2022
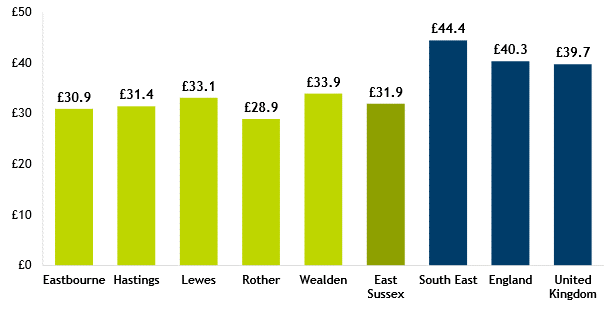
Table 7: GVA per hour worked (smoothed) in 2012, 2017, 2021 and 2022
| 2012 | 2017 | 2021 | 2022 | |
| Eastbourne | £22.5 | £25.7 | £31.2 | £30.9 |
| Hastings | £22.0 | £25.8 | £30.8 | £31.4 |
| Lewes | £23.1 | £26.3 | £32.3 | £33.1 |
| Rother | £20.7 | £24.6 | £28.7 | £28.9 |
| Wealden | £22.0 | £25.1 | £33.0 | £33.9 |
| East Sussex | £22.1 | £25.4 | £31.4 | £31.9 |
Figure 7: Productivity and earnings measures compared – East Sussex indices, where UK=100
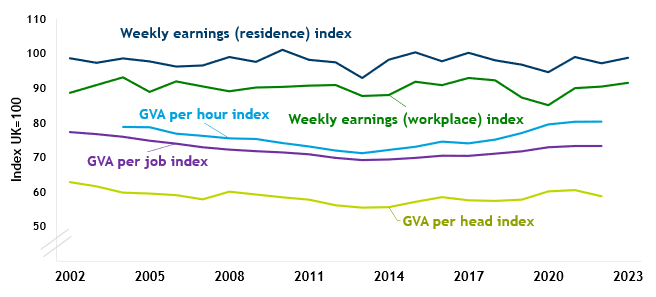
Weekly workplace full-time earnings have fluctuated at around 90% of the UK average and rose to 91.6% in 2023. Weekly residence-based full-time earnings are similar to the UK average (98.8%). This reflects high levels of out commuting by East Sussex residents.
The GVA per head index fell slightly to 58.8% of the national average in 2022. The GVA per hour index was 80.4% of the UK in 2022). The GVA per filled job index was 73.3% of UK in 2022. Both remained steady between 2021 and 2022. They have been on the increase since 2013.
Sector differences: GVA by industry in 2022
In East Sussex, Owner-Occupiers’ Imputed Rental* (OOIR) contributed 20.0% to our GVA, the highest of any ITL3 area outside four London ITL3 areas, in 2022. In Rother, 25.6% of GVA was made up of OOIR in 2022, the highest of all districts in the county.
The top 5 sectors in East Sussex in 2022
| Real Estate – including owner occupiers imputed rental (24%) (OOIR accounts for 20%) | |
| Health (11%) | |
| Wholesale, retail & motors (10%) | |
| Construction (8%) | |
| Education (8%) |
*Owner-occupiers’ imputed rental is an estimate of the housing services consumed by households who are not actually renting their residence. It can be thought of as the amount that non-renters pay themselves for the housing services that they produce. See ONS website for more information.
Table 8: Percentage of Total GVA by industry in 2022
| East Sussex | South East | England | UK (less extra regio) | |
| Agriculture, mining, utilities | 3.4% | 3.4% | 2.9% | 3.3% |
| Manufacturing | 7.5% | 7.8% | 9.1% | 9.4% |
| Construction | 8.3% | 6.9% | 6.2% | 6.2% |
| Wholesale and retail trade; repair of motors | 10.3% | 11.6% | 10.5% | 10.5% |
| Transportation and storage | 1.9% | 3.6% | 3.6% | 3.5% |
| Accommodation and food services | 4.8% | 3.2% | 3.1% | 3.2% |
| Information and communication | 1.7% | 8.7% | 7.0% | 6.6% |
| Finance and insurance | 0.6% | 5.5% | 9.3% | 9.1% |
| Real estate activities | 24.4% | 14.0% | 12.8% | 12.6% |
| Professional, scientific and technical | 3.9% | 8.9% | 8.7% | 8.3% |
| Administrative and support services | 2.9% | 5.2% | 5.3% | 5.1% |
| Public administration and defence | 6.5% | 4.6% | 4.8% | 5.1% |
| Education | 8.1% | 6.4% | 6.0% | 6.0% |
| Human health and social work activities | 10.5% | 6.8% | 7.5% | 7.9% |
| Arts, entertainment and recreation | 1.7% | 1.4% | 1.4% | 1.4% |
| Other service activities | 3.1% | 1.9% | 1.7% | 1.7% |
| Activities of households | 0.4% | 0.2% | 0.1% | 0.1% |
If OOIR is included, Real Estate is by far the biggest sector in the county. It accounts for nearly a quarter of all GVA.
If we remove OOIR, Health and Social care becomes the largest sector. Health makes up 13.1% of total GVA (excluding OOIR). This next largest sectors are Wholesale, Retail and Motors (12.9%), Construction (10.3%), and Education (10.1%).
The smallest sector in the county is Finance and Insurance, which made up only 0.6% of GVA in 2022. (0.8% of GVA if you exclude OOIR). This is down from a peak of 1.8% in 2014.
Table 9: Percentage of GVA (excluding OOIR) by industry in 2022
| East Sussex | South East | England | UK (less extra regio) | |
| Agriculture, mining, electricity, gas, water and waste | 4.2% | 3.8% | 3.1% | 3.6% |
| Manufacturing | 9.4% | 8.7% | 10.0% | 10.4% |
| Construction | 10.3% | 7.7% | 6.8% | 6.9% |
| Wholesale and retail trade; repair of motor vehicles | 12.9% | 13.0% | 11.6% | 11.5% |
| Transportation and storage | 2.3% | 4.0% | 3.9% | 3.9% |
| Accommodation and food service activities | 6.0% | 3.5% | 3.5% | 3.5% |
| Information and communication | 2.2% | 9.7% | 7.7% | 7.2% |
| Financial and insurance activities | 0.8% | 6.2% | 10.2% | 9.9% |
| Real estate activities, excluding imputed rental | 5.4% | 3.6% | 4.1% | 4.0% |
| Professional, scientific and technical activities | 4.9% | 9.9% | 9.5% | 9.1% |
| Administrative and support service activities | 3.6% | 5.9% | 5.8% | 5.6% |
| Public administration and defence | 8.2% | 5.1% | 5.3% | 5.7% |
| Education | 10.1% | 7.2% | 6.6% | 6.6% |
| Human health and social work activities | 13.1% | 7.6% | 8.2% | 8.7% |
| Arts, entertainment and recreation | 2.1% | 1.6% | 1.6% | 1.5% |
| Other service activities | 3.8% | 2.2% | 1.9% | 1.9% |
| Activities of households | 0.6% | 0.2% | 0.2% | 0.1% |
Figure 8: Percentage of GVA (excluding Owner-occupiers imputed rental, OOIR) by industry in 2022, East Sussex, South East region and United Kingdom (less extra regio)
Sectors ordered by largest sectors in East Sussex.
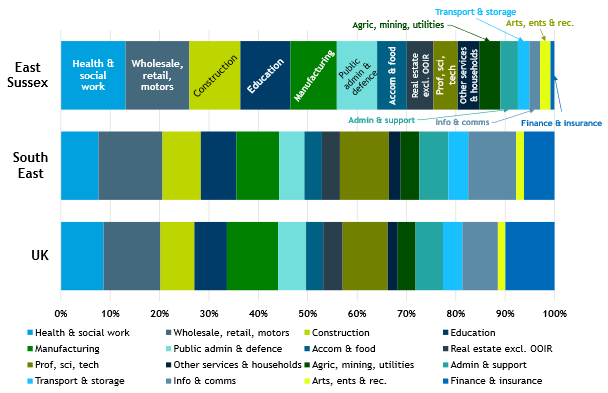
Table 10: Percentage of GVA (excluding OOIR) by industry in 2022
| Eastbourne | Hastings | Lewes | Rother | Wealden | |
| Agriculture, mining, utilities | 0.8% | 1.6% | 10.4% | 4.7% | 3.7% |
| Manufacturing | 7.6% | 12.7% | 6.8% | 8.1% | 11.5% |
| Construction | 6.7% | 6.8% | 8.3% | 12.4% | 16.0% |
| Wholesale and retail trade; repair of motor vehicles | 14.6% | 12.9% | 11.8% | 10.9% | 13.5% |
| Transportation and storage | 1.6% | 2.5% | 3.2% | 2.5% | 2.1% |
| Accommodation and food service activities | 5.8% | 5.7% | 4.0% | 9.9% | 5.8% |
| Information and communication | 3.0% | 1.6% | 2.2% | 1.6% | 2.1% |
| Financial and insurance activities | 0.9% | 0.6% | 0.2% | 2.8% | 0.2% |
| Real estate activities, excluding imputed rental | 4.0% | 9.3% | 3.7% | 7.8% | 4.3% |
| Professional, scientific and technical activities | 4.6% | 3.3% | 4.6% | 4.0% | 6.9% |
| Administrative and support service activities | 2.7% | 1.8% | 2.2% | 3.5% | 6.4% |
| Public administration and defence | 5.7% | 11.3% | 17.6% | 4.1% | 3.2% |
| Education | 10.0% | 7.3% | 10.6% | 12.6% | 10.3% |
| Human health and social work activities | 19.6% | 19.4% | 8.5% | 10.7% | 8.6% |
| Arts, entertainment and recreation | 2.1% | 1.6% | 2.7% | 1.6% | 2.4% |
| Other service activities | 9.9% | 1.1% | 2.8% | 1.7% | 2.3% |
| Activities of households | 0.5% | 0.6% | 0.5% | 0.7% | 0.6% |
| Total GVA (£m) | 2,231 | 1,711 | 2,179 | 1,559 | 3,007 |
Sector growth and concentrations
Location quotient (LQ) is a valuable way of measuring the concentration of a sector in an area. It is compared to the UK as a whole. This can help identify the county’s areas of competitive advantage. An LQ > 1 implies that the industry generates more GVA than the average. An LQ of <1 means that that industry is not currently an area of strength in the economy. The LQ help us to compare the county to other ITL 3 geographies in the UK.
Sub-sectors showing particular strengths in the East Sussex economy:
The sub-sectors with the highest LQs (excluding OOIR) are:
| Activities of households** | 3.43 |
| Other personal service activities | 2.38 |
| Manufacture of electronic, optical and electrical products | 2.34 |
| Veterinary activities | 2.22 |
| Specialised construction activities | 1.99 |
Overall, Manufacturing in East Sussex is now slightly less concentrated than the average, with an LQ of 0.80. However, the Electronic, optical and electrical manufacturing (2.34), and Manufacture of wood, paper products and printing (1.68) sub-sectors are more concentrated than average.
In 2022, Manufacture of electronic, optical and electrical products made up 2.2% of the county’s total GVA (inc OOIR). This sector only employs around 1.2% of employees in the county. In Hastings, however, 2.7% are employed in this sector. (Business Register and Employment Survey, ONS, 2022).
**The ‘Activities of households’ sector is mainly made up of businesses which have been set up to manage properties. These could be either structures for leaseholders to manage a jointly owned freehold, or ‘tax efficiency’ measures taken by individuals. In addition to this are small number of more ‘domestic’ companies. These provide services such as home care support, childminding, and home tuition. These services could be classified in the Health and care or Education sectors.
Lowest Location Quotients in East Sussex
The 5 sub-sectors with the lowest LQs are:
| Financial service activities | 0.05 |
| Insurance, pension funding and auxiliary activities | 0.09 |
| R&D; advertising & market research | 0.15 |
| Warehousing and transport support activities | 0.16 |
| Telecommunications, IT | 0.22 |
Further information
Gross value added (GVA) is a measure of the increase in the value of the economy due to the production of goods and services. Regional balanced GVA gives users a single measure of the activity of the economy in a region. Estimates are measured at current basic prices, which include the effect of inflation. A rate of GVA per head enables GVA to be compared across areas of different sizes, but means that areas with a larger proportion of economically inactive people, such as pensioners, appear to generate less economic value.
Data for subregional productivity, giving GVA per filled job and GVA per hour worked for 2020 is also now available from ONS and published on ESiF. These measures take a better account of the county’s age structure than GVA per head.
In 2021, Gross Domestic Product data for the county and districts was published for the first time. Gross domestic product (GDP) measures the value of goods and services produced by an economy. It estimates the total size of and growth in the economy. Gross value added (GVA) is the value generated by any unit engaged in production and the contributions of individual sectors or industries to gross domestic product.
The link between GVA and GDP is:
| GVA at basic prices | |
| + | taxes on products |
| – | subsidies on products |
| = | GDP at market prices (or headline GDP) |
See the ONS’ detailed explanation of the difference between GDP and GVA.
Different measures are useful for measuring different aspects of economic performance, for example
| How much value is created in an area? | – use Total GVA £m |
| Value created in an area relative to total population? | – use GVA per head |
| How productive are the workforce? | – use GVA per hour or job |
| Total value of the economy? | – use GDP |
With the publication of the 2022 data in April 2024, data for previous years were revised. In addition to this, the most recent data is labelled as provisional, and will be finalised with the next release of data for 2023. Please ensure you use only the most recent data.
Links
For more information about GVA data visit the ONS website.
ONS also publish data for GVA by industry for lower tier local authorities and by industry for ITL geographies.
Data for Sub-regional productivity by district, and for ITLs 2 and 3, is also available from the ONS.
Contact details
For further information about data about the county’s economic performance and productivity please contact Lenna Santamaría or the R&I team by emailing esif@eastsussex.gov.uk.
The Research and Intelligence Team, Governance Services, provides demographic and socio-economic data, intelligence and insight to support East Sussex County Council and other East Sussex Partners.
ESiF is a web-based information system that contains detailed information on a very wide range of topics. Visit www.eastsussexinfigures.org.uk to find out more.
