
Page Contents
Introduction
This briefing has been developed to support decisions to prioritise areas of work for the Healthy Weight Partnership (HWP). The purpose of this briefing is to outline key nationally available data to help set the context for local needs and inequalities relating specifically to physical activity. It collates analysis at an East Sussex level for a range of publicly available data and, where possible, this information has been benchmarked nationally. Where local data on health inequalities is not available, national evidence is presented.
Data are drawn from many sources and vary by time period, population and presentation of values, so care should be taken with interpretation – the data is meant as guidance to complement local knowledge and expertise. Where possible the relationships to national or local benchmarks are marked using the following key: amber – similar to benchmark, green – significantly better than benchmark (95% confidence), red – significantly worse than benchmark (95% confidence).
Key findings
East Sussex
- Physical activity among young people has risen nationally and locally over the past decade
- Hastings has a significantly higher proportion of physically active young people compared to nationally
- Physical activity levels decrease among young people as age increases
- Boys are more likely to be physically active than girls and those identifying as another gender identity.
- The daily amount of screen time increases with age, peaking among secondary school students
England
- Those from Asian, Black and Other ethnic backgrounds, those in year 3-6, and girls, are significantly less likely to meet UK physical activity recommendations compared to the England average.
- 91% children and young people in school years 1-11 participated in sports activities in the last week, similar to last year, but significantly less (1.7%) than a decade ago
- In 2024, the most common mode of transport travelling to and from school was walking, followed by travelling by car.
- Walking and car use to for school travel have both increase by 2% over the last decade, while bus use has declined by 3%.
- Walking among primary school children has increased over the last decade and car use has decreased, while the opposite is true for secondary school children.
Contextual Factors
Our young population
- Young people make up 18.6% of the total population in East Sussex in 2024. This is lower than the regional (21.0%) and national (20.8%) averages.
- 48.5% of the 0-19 population are female (n=56,049) and 51.5% male (n=59,422)
Figure 1: East Sussex population age and gender profile, 0-19 years, 2024
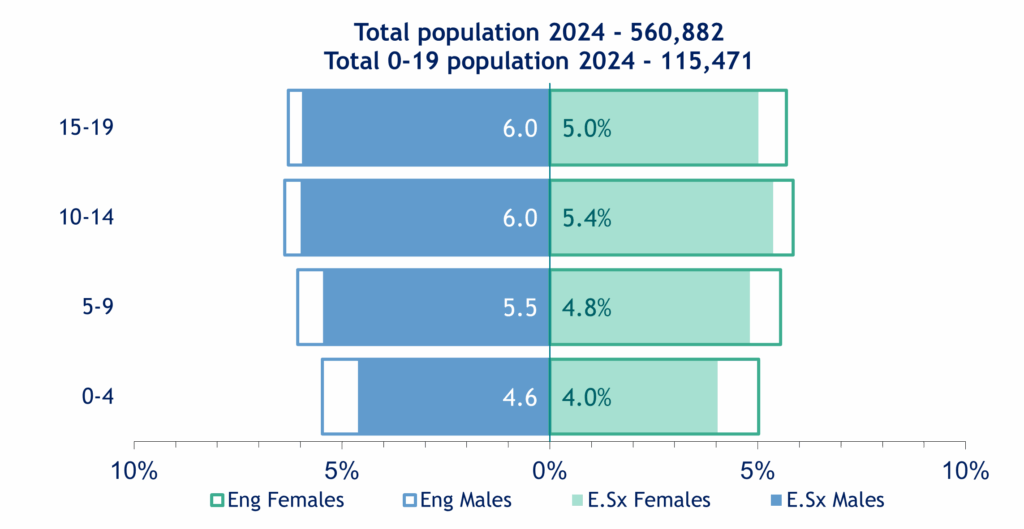
Source: ONS, Mid-year population estimates, 2024
School age population in East Sussex:
- The population of 0-17 year olds in East Sussex has increased by just 0.1% (64 children) since 2014, from 104,364 in 2014 to 104,428 in 2024. In England and the South East numbers rose by 5.6% and 6.9% respectively.
- Overall numbers of school-age children (aged 4-15) have risen in the county over the last decade (up 4.2%). However the number of primary aged children (4-10) fell by 0.9%, while the number of secondary age (11-15) increased by 11.3%.
- Wealden, Rother and Eastbourne saw increases in the number of children and young people between 2014 and 2024, with numbers up by 4.0% in Wealden (up 1,224), 2.3% in Rother (361 children) and 0.9% in Eastbourne (170). But numbers fell in Hastings by 6.2% (down 1,183) and in Lewes by 2.6% (down 508).
Figure 2: Population change among children and young people in East Sussex, 2014-2024
Source: ONS, Mid-year population estimates, 2024
Deprivation
- The Index of Multiple Deprivation (IMD) 2019 is the official measure of relative deprivation for small areas (or neighbourhoods) in England. The IMD combines information from seven domains to produce an overall relative measure of deprivation: Income; Employment; Education; Skills and Training; Health and Disability; Crime; Barriers to Housing Services; Living Environment.
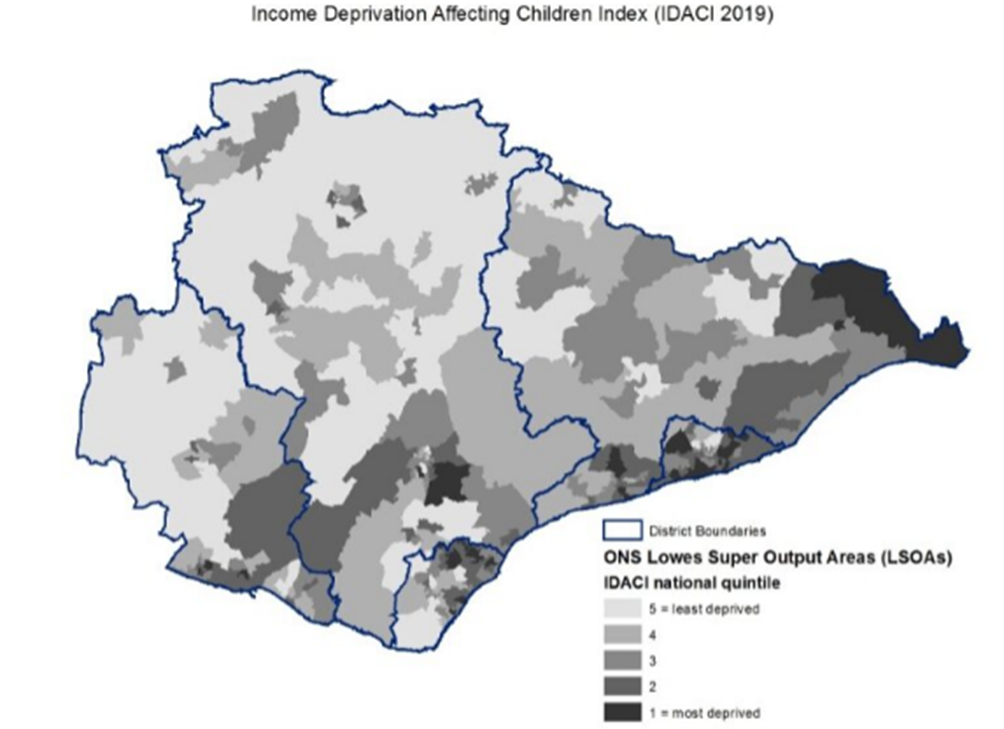
- The IDACI is a subset of the Income Deprivation Domain, with the Index showing the proportion of children aged 0 – 15 in each of the 32,844 neighbourhoods in England that live in families that are income deprived.
- 19 East Sussex neighbourhoods (LSOAs) are classified as being within the 10% most deprived in England in terms of income deprivation affecting children, and 52 neighbourhoods are in the 20% most deprived in England.
Figure 3: Income Deprivation Affecting Children Index (IDACI) Deciles | 2019
Source: MHCLG, 2019
- The neighbourhoods with children that live in families that are amongst the 10% most income deprived in the country are concentrated primarily around coastal areas of the county.
Map 1: Income Deprivation Affecting Children Index (IDACI 2019)
Children living in poverty
- In 2023/24, 15.2% of the under 16 population of East Sussex lived in absolute low income families. This refers to people living in households with income below 60% of median income in 2011, adjusted for inflation. This is significantly better than England (19.1%)
- Hastings is significantly worse than England (22.9%) while all other districts and boroughs are significantly better. This has been the pattern since 2017/18
Figure 4: Children and Young people under 16 living in absolute poverty, 2023/24
Source: OHID, based on Department for Work and Pensions and Office for National Statistics data
- In 2023/24, 18% of the under 16 population of East Sussex lived in relative low income families. This refers to people living in households with income below 60% of the median in that year. This is significantly better than England (22.1%)
- Over a quarter of under 16s live in relative poverty in Hastings (27%), this is significantly worse than England. while all other districts and boroughs are significantly better. This has been the pattern since 2017/18
Figure 5: Children and Young people under 16 living in relative poverty, 2023/24
Source: OHID, based on Department for Work and Pensions and Office for National Statistics data
Ethnicity
- 86% of the East Sussex 0-19 population were identified as White British (White English, Welsh, Scottish, Northern Irish or British) in the 2021 Census, followed by 5.5% Mixed or Multiple Ethnic Groups. This compares to 88.3% people of all ages in East Sussex identifying as White British and 2.3% as Mixed or Multiple Ethnic Groups.
Figure 6: East Sussex 0-19 population by broad ethnic group, 2021
Source: ONS, Census 2021
Physical activity
Physical activity in East Sussex
- Hastings has a significantly higher proportion of physically active children and young people compared to nationally
- Between 2017/18 and 2023/24 physical activity among children rose nationally and regionally by 4.5%, while East Sussex saw a slightly higher rise of 5.5%.
Figure 7: Percentage of physically active children and young people aged 5-16 2023/24
Source: OHID, based on Sport England data
Table 1: Percentage of physically active children and young people aged 5-16, 2017/18 to 2023/24
| 2017/18 | 2018/19 | 2019/20 | 2020/21 | 2021/22 | 2022/23 | 2023/24 | |
| England | 43.3 | 46.8 | 44.9 | 44.6 | 47.2 | 47 | 47.8 |
| South East | 43.7 | 47.8 | 47.5 | 45.4 | 48.1 | 47.2 | 48.2 |
| East Sussex | 44.2 | 52.2 | 40.9 | 41.6 | 48.8 | 51.8 | 49.7 |
Source: OHID, based on Sport England data
- A greater percentage of primary students (84%) report being ‘usually physically active for at least 60 minutes on most days’ in a normal week compared to secondary students (76%) and college students (66%).
- For all age groups, boys are more likely to be physically active on most days for at least 60 minutes compared to girls and those identifying as another gender identity.
Figure 8: In a normal week, are you usually physically active for at least 60 minutes on most days? – Yes
Source: East Sussex My Health My School Survey, 2023/24
- When asked whether anything stops them from taking part in physical activities, 64% of primary, 56% of secondary and 46% of college students reported that nothing stops them. The top two reported barriers for not taking part are:
| Primary students | Secondary students | College students |
| ‘I don’t have the time’ (11%) | ‘I choose not to’ (16%) | ‘Too much college work’ (30%) |
| I choose not to’ (11%) | ‘I have no one to go with’ (15%) | ‘I don’t have the time’ (28%) |
- The daily amount of screen time increases with age, with 21% of primary students reporting spending more than 5 hours a day compared to 34% of secondary and 32% of college students.
Figure 9: Hours spent, on a normal school day, sitting down watching TV/playing computer games/using the internet/using a mobile phone
Source: East Sussex My Health My School Survey, 2023/24
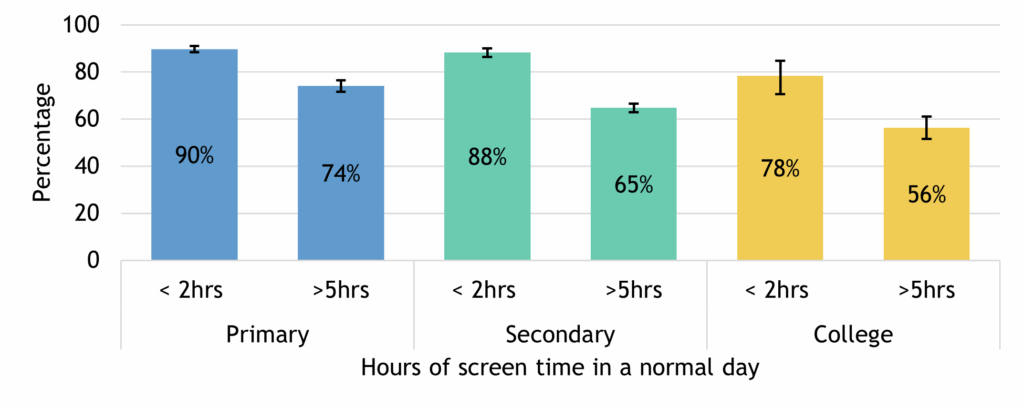
- Across all age groups, physical activity levels are lower for those spending more time on screens in a normal day
- Children in primary school are significantly more likely to be physically active while spending over 5 hours of the day on screen time (74%), than secondary (65%) or college (56%) students.
- Primary and secondary school pupils who spend less than 2 hours daily on screens have similar physical activity levels across the week (90% and 88% respectively are physically active), significantly higher than college students (78%)
Figure 10: young people usually physically active for at least 60 minutes on most days in a normal week, by hours spent on screen in a normal day
- Girls in primary school are more likely to be physically active while spending over 5 hours of the day on screen time (70%), than secondary (61%) or college (51%) students, while boys in primary and secondary schools are equally likely (77%) to be physically active whilst spending over 5 hours a day on screen time.
- Across all age groups girls who spend over 5 hours in a normal day on screen time are less likely to be physically active than boys.
Table 2: Percentage of students who are usually physically active for at least 60 minutes on most days by sex and hours of screen time on a normal day
Table 2: Percentage of students who are usually physically active for at least 60 minutes on most days by sex and hours of screen time on a normal day
| Primary | Secondary | College | ||||
| boys | girls | boys | girls | boys | girls | |
| Under 2 hours | 91% | 89% | 90% | 88% | 89% | 71% |
| Over 5 hours | 77% | 70% | 77% | 61% | 62% | 51% |
Source: East Sussex My Health My School Survey, 2023/24
Physical activity in England
Health inequalities in physical activity
- Children and young people from Asian, Black and Other ethnic backgrounds, in year 3-6 at school or who are female are significantly less likely to meet UK physical activity recommendations compared to the England average.
Table 2: Percentage of children aged 5 to 16 that meet the UK recommendations for physical activity (on average at least 60 minutes moderate to vigorous intensity activity per day
| 2023/24 | ||
| England average | 47.8 | |
| Ethnicity | Asian | 43.1 |
| Black | 42.3 | |
| Mixed | 49.4 | |
| White British | 49.9 | |
| White Other | 49.9 | |
| Other | 43.9 | |
| School Year | Year 1-2 | 53 |
| Year 3-6 | 43.8 | |
| Year 7-8 | 49 | |
| Sex | Male | 51.2 |
| Female | 44.8 |
Source: OHID, based on Sport England data
- 91.4% children and young people in school years 1-11 participated in activities in the last week of moderate plus intensity (raised heartbeat and a little out of breath).
Figure 10: Activities taken part in over the last week, England, 2023/24 (Children and Young People in school years 1-11)
Source: Sport England, Active lives Children and Young People Survey, 2024
- There has been no change in the proportion of children and young people participating in activities over the last 12 months, however, there has been a significant decrease (1.7%) in participation since 2017/18.
- Since 2017/18 there has been a significant increase in participation in active play, walking, gym or fitness and active travel. However, there has been a significant decrease in sporting activities and cycling.
Table 3: Activities taken part in over the last week, England, 2017/18 to 2023/24 (Children and Young People in school years 1-11)
| Broad Activity Groups | 2017/18 | 2018/19 | 2019/20 | 2020/21 | 2021/22 | 2022/23 | 2023/24 |
| All activities | 92.9% | 94.9% | 93.4% | 91.9% | 91.6% | 91.4% | 91.4% |
| Sporting activities | 81.9% | 85.5% | 79.9% | 73.7% | 79.6% | 80.2% | 79.8% |
| Active play and informal activities | 59.8% | 64.9% | 60.7% | 55.9% | 62.1% | 62.6% | 62.4% |
| Walking | 49.2% | 51.0% | 61.9% | 63.5% | 61.2% | 61.4% | 61.7% |
| Dance | 29.3% | 30.5% | 29.4% | 33.4% | 31.3% | 30.0% | 30.2% |
| Cycling | 24.5% | 27.2% | 27.1% | 26.6% | 22.4% | 20.6% | 20.8% |
| Riding a scooter | 15.5% | 17.2% | 16.6% | 16.5% | 14.2% | 15.1% | 15.7% |
| Gym or fitness | 11.2% | 12.0% | 15.1% | 22.2% | 20.9% | 23.0% | 23.3% |
| Active Travel | 46.8% | 51.4% | 59.1% | 56.4% | 57.5% | 58.3% | 59.2% |
Source: Sport England, Active lives Children and Young People Survey, 2024
- The significant decrease in sports activities is seen in both boys and girls participation over the last decade, with boys participation decreasing by 1.1% and girls by 1.8%.
- Whilst sporting activities and cycling have decreased for both boys and girls, there have significant increases in all other activity categories for boys with the exception of scooter riding, and for girls with the exception of dance.
- The activities with the greatest significant increases are gym/fitness (13.4%) and walking (12.8%) for boys, and active travel (14.1%) and walking (12.3%) for girls.
Table 4: Activities taken part in over the last week, England, 2017/18 to 2023/24 (boys and girls in school years 1-11)
| Boys | Girls | |||
| Broad Activity Groups | 2023/24 | Change from 2017/18 | 2023/24 | Change from 2017/18 |
| All activities | 91.3% | -1.1% | 92.2% | -1.8% |
| Sporting activities | 82.7% | -1.3% | 78.1% | -2.6% |
| Active play and informal activities | 68.9% | 4.1% | 57.7% | 2.0% |
| Walking | 57.8% | 12.8% | 66.9% | 12.3% |
| Dance | 13.9% | 1.0% | 47.7% | 0.8% |
| Cycling | 25.6% | -3.6% | 16.1% | -3.4% |
| Riding a scooter | 16.7% | -0.2% | 16.0% | 1.1% |
| Gym or fitness | 23.6% | 13.4% | 22.5% | 10.5% |
| Active Travel | 57.4% | 10.8% | 62.2% | 14.1% |
Source: Sport England, Active lives Children and Young People Survey, 2024
Sports participation
- In 2024, a survey of 4,000 school pupils found that 85% spent some time every day or most days outside when they were at school. Time spent outside at school has decreased over the last four years from 88% in 2021, this is primarily due to a fall in the numbers spending time outside every day.
Figure 11: Time spent outside at school, 2021-2024
Source: The Children’s People and Nature Survey for England: 2024 update
- When asked about time sent in the last week in green/blue space outside of school, the most popular area to spend time was in the garden (66%), followed by a park, playing field or playground (62%) and grassy areas in the streets near home (43%)
- Time spent in all these spaces has declined since 2022, although there have been slight increases in other spaces, including: grassy areas you pay for; fields, farmlands and countryside; rivers, lakes and canals; and hills, mountains and moorlands.
- Those broadly more likely to spend time in green/blue spaces in 2024 include: 8-11 year olds compared to 12-15 year olds; boys; those without a disability; those living in rural areas.
Figure 12: Have you spent any time in the following spaces in the last week – 2022-2024
Source: The Children’s People and Nature Survey for England: 2024 update
Time spend outside at school
Transport to and from school
- Data from the 2024 National Travel Survey shows that nearly half of 5-16 year olds walked to school while over a third travelled by car.
- Both walking and car use declines with age, offset by a rise in private and local bus use in 11-16 year olds compared to 5-10 year olds.
Figure 13: Trips to and from school by main mode and age, aged 5 to 16: England, 2024
Source: National Travel Survey, 2024
- Between 2014 and 2024, there has been a slight increase in the proportion of children and young people walking to and from school (+2%), travelling by car (+2%) and travelling by private bus (+2%). The percentage of 5-16 year olds walking to school rose by 3% to 46%. Conversely, 3% less children and young people travel by bus in comparison to 10 years ago.
- However, there have been marked differences between primary school and secondary school aged young people:
- 5% more primary school children walk to and from school and 4% less take a car/van compared to 10 years ago
- Conversely, 1% less secondary school children walk, with 7% more young people travelling by car/van and 3% more taking a private bus. Local bus use has dropped by 6%.
Figure 14: Trips to and from school by main mode, aged 5 to 16: England, 2014-2024
Source: National Travel Survey, 2024
Table 5: Trips to and from school by main mode, aged 5 to 10: England, 2014-2024
| 2014 | 2015 | 2016 | 2017 | 2018 | 2019 | 2020 | 2021 | 2022 | 2023 | 2024 | Difference 2014-2024 | |
| Walk | 46 | 44 | 51 | 49 | 49 | 46 | 50 | 51 | 53 | 47 | 51 | 5 |
| Bicycle | 2 | 1 | 2 | 1 | 2 | 1 | 1 | 1 | 1 | 1 | 1 | 0 |
| Car / van | 46 | 48 | 41 | 44 | 45 | 47 | 47 | 45 | 40 | 45 | 43 | -4 |
| Private bus | 2 | 2 | 2 | 2 | 1 | 2 | 1 | 0 | 1 | 2 | 2 | 0 |
| Local bus | 3 | 4 | 3 | 3 | 2 | 3 | 1 | 3 | 4 | 2 | 2 | -1 |
| Surface rail | 0 | 0 | 0 | 0 | 0 | 0 | 0 | 0 | 0 | 0 | 0 | 0 |
| Other | 1 | 1 | 2 | 1 | 1 | 1 | 1 | 1 | 1 | 1 | 1 | 0 |
Table 6: Trips to and from school by main mode, aged 11-16: England, 2014-2024
| 2014 | 2015 | 2016 | 2017 | 2018 | 2019 | 2020 | 2021 | 2022 | 2023 | 2024 | Difference 2014-2024 | |
| Walk | 38 | 37 | 39 | 39 | 39 | 39 | 44 | 37 | 41 | 44 | 37 | -1 |
| Bicycle | 3 | 2 | 3 | 3 | 4 | 3 | 4 | 5 | 6 | 3 | 2 | -1 |
| Car / van | 23 | 26 | 26 | 25 | 24 | 26 | 28 | 27 | 26 | 28 | 30 | 7 |
| Private bus | 6 | 6 | 4 | 6 | 8 | 6 | 8 | 13 | 7 | 5 | 9 | 3 |
| Local bus | 24 | 23 | 23 | 23 | 21 | 23 | 12 | 14 | 16 | 14 | 18 | -6 |
| Surface rail | 3 | 3 | 3 | 3 | 2 | 2 | 4 | 1 | 2 | 4 | 1 | -1 |
| Other | 3 | 2 | 1 | 1 | 3 | 2 | 1 | 3 | 2 | 2 | 3 | 0 |
Source: National Travel Survey, 2024
Key information sources
- East Sussex in Figures – Data Observatory – Population estimates in 2024 (August 2025)
- My Health My School survey 2023-2024 |
- Obesity, physical activity and nutrition – Data | Fingertips | Department of Health and Social Care
- Mode of travel – GOV.UK
- The Children’s People and Nature Survey for England: 2024 update – GOV.UK
- Children’s sports participation England 2024| Statista